On July 16, 2025, at 12:37 PM Alaska time, a magnitude 7.3 earthquake struck offshore of the Alaska Peninsula region (Figure 1), two years after a previous magnitude 7.2. This area has been active over the past several years with a series of earthquakes of magnitude 7 or greater (Figure 2). This event, located 55 miles (89 km) south of Sand Point, Alaska, was felt over a broad region, extending as far as Anchorage and Juneau, where reported shaking was light. Ground shaking was the strongest in Sand Point, where one resident reported objects flying out of the pantry and off of shelves. In Homer, it was described as mild rolling, with lamps and plants swaying. We have not received reports of significant damage in the communities nearest to the epicenter.
The July 16, 2025, and July 15, 2023 earthquakes are within the previous aftershock zone of the July 2020 M7.8 Simeonof Earthquake that occurred in the same region. Today’s (July 16, 2025) earthquake may be associated with the prolonged aftershock sequence within the region of the M7.8 Simeonof Earthquake. Today’s earthquake is generating aftershocks, with 40 detected within the first 3 hours, the largest a magnitude 5.2 (Figures 3 & 4). Aftershocks are likely to persist in the foreseeable future. The USGS Aftershock Forecast indicates that at least one magnitude 6 or greater is possible in the next week, and smaller earthquakes are highly likely to continue. This region of the Alaska–Aleutian Megathrust has experienced five magnitude 7 or greater earthquakes over the last five years and represents an area of increased seismic activity (Figure 2).
The National Tsunami Warning Center issued a tsunami warning immediately after the earthquake, but downgraded it about an hour later to an advisory. Several communities issued tsunami evacuations, including Sand Point, King Cove, Kodiak, Old Harbor, Homer, Seward, and Unalaska. While no tsunami was observed for this event, the issued tsunami warning helps communities nearby quickly respond with very little time to evacuate. If an impactful wave had been generated during this event, those communities closest to the epicenter would have had minutes to evacuate.
The Alaska Earthquake Center works with other agencies and communities to help provide information on tsunami hazards and evacuation areas. Explore tsunami hazard information by community on our website, and see if where you work, live, or play is within a hazard zone on our interactive map at tsunami.alaska.edu.
While earthquakes are typically represented by dots on a map, it is important to recognize that the area of rupture could be a few hundred square miles (June 2025 Episode 47 What’s Shaking Alaska).
The Earthquake Center's Michael West, the state seismologist, gives an update on the magnitude 7.3 earthquake several hours after the earthquake happened.
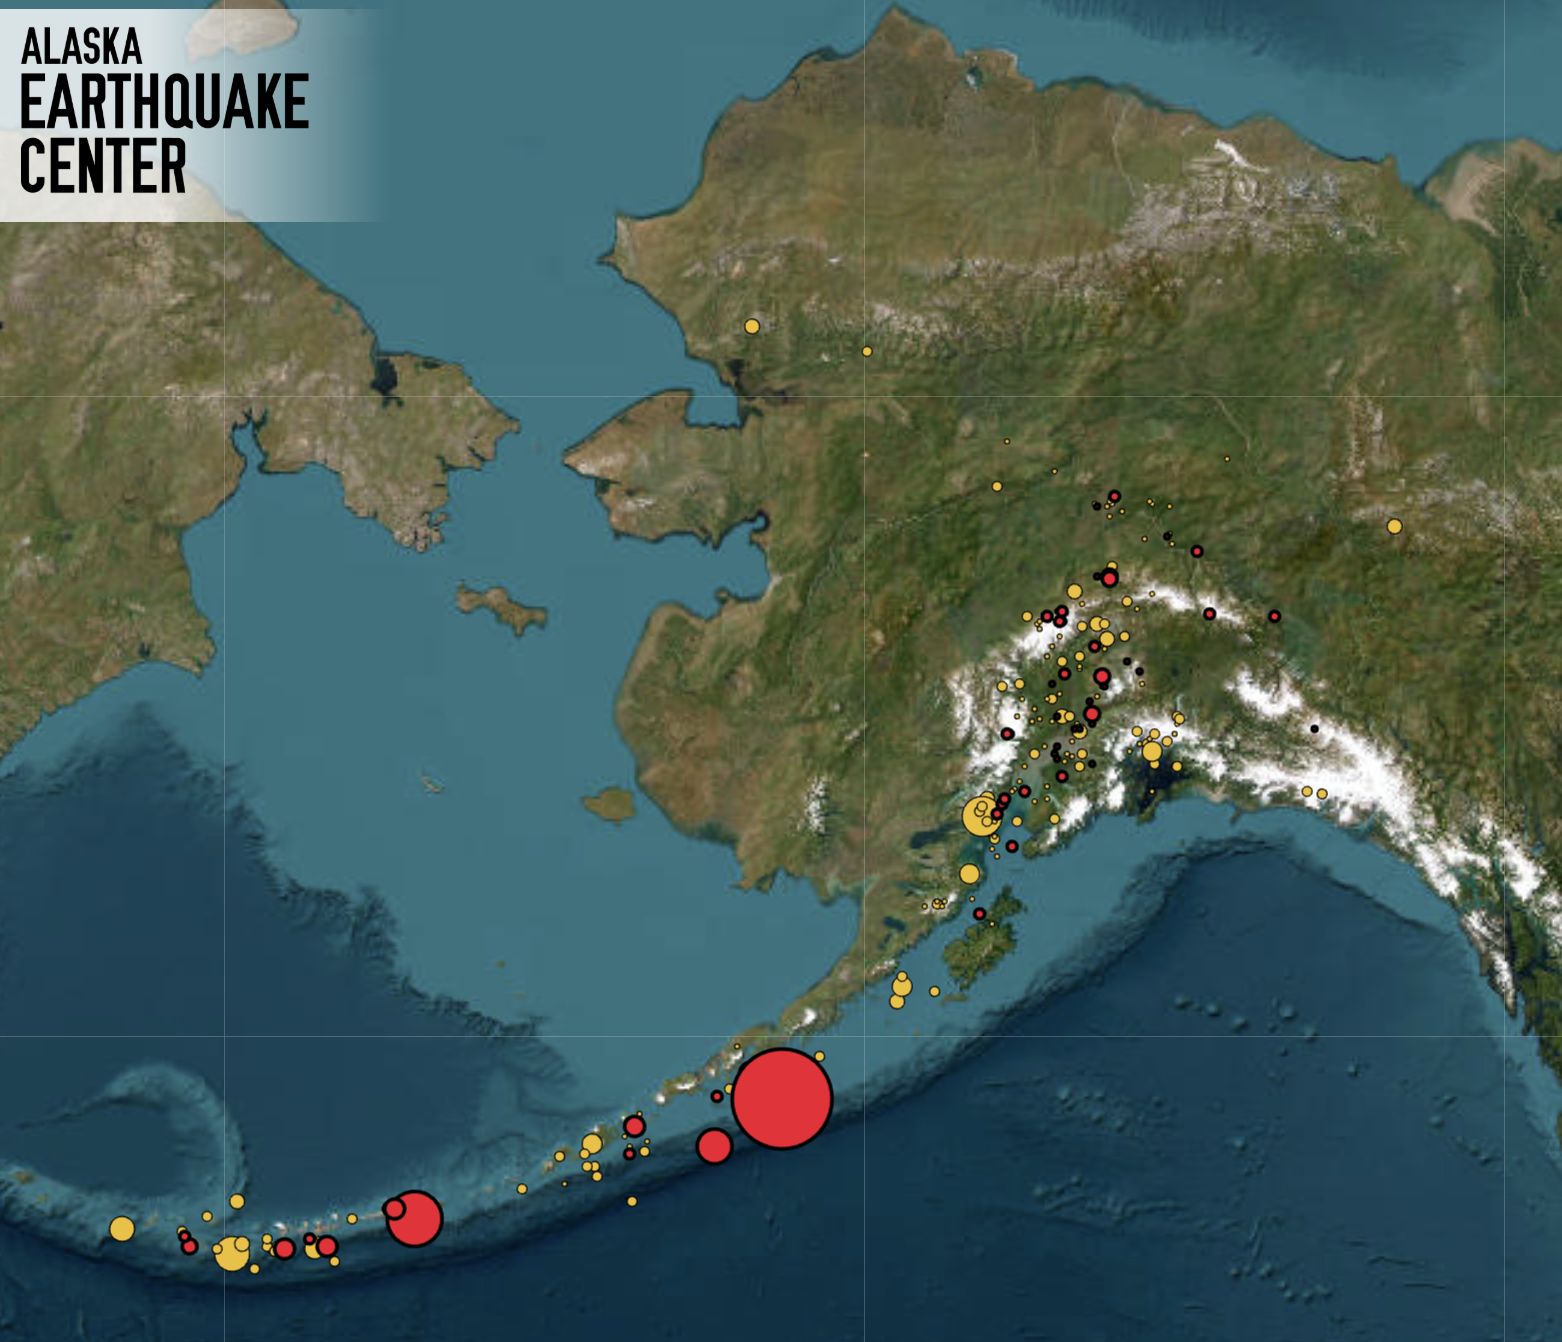
Figure 1. The magnitude 7.3 earthquake (largest red dot) occurred south of Sand Point.
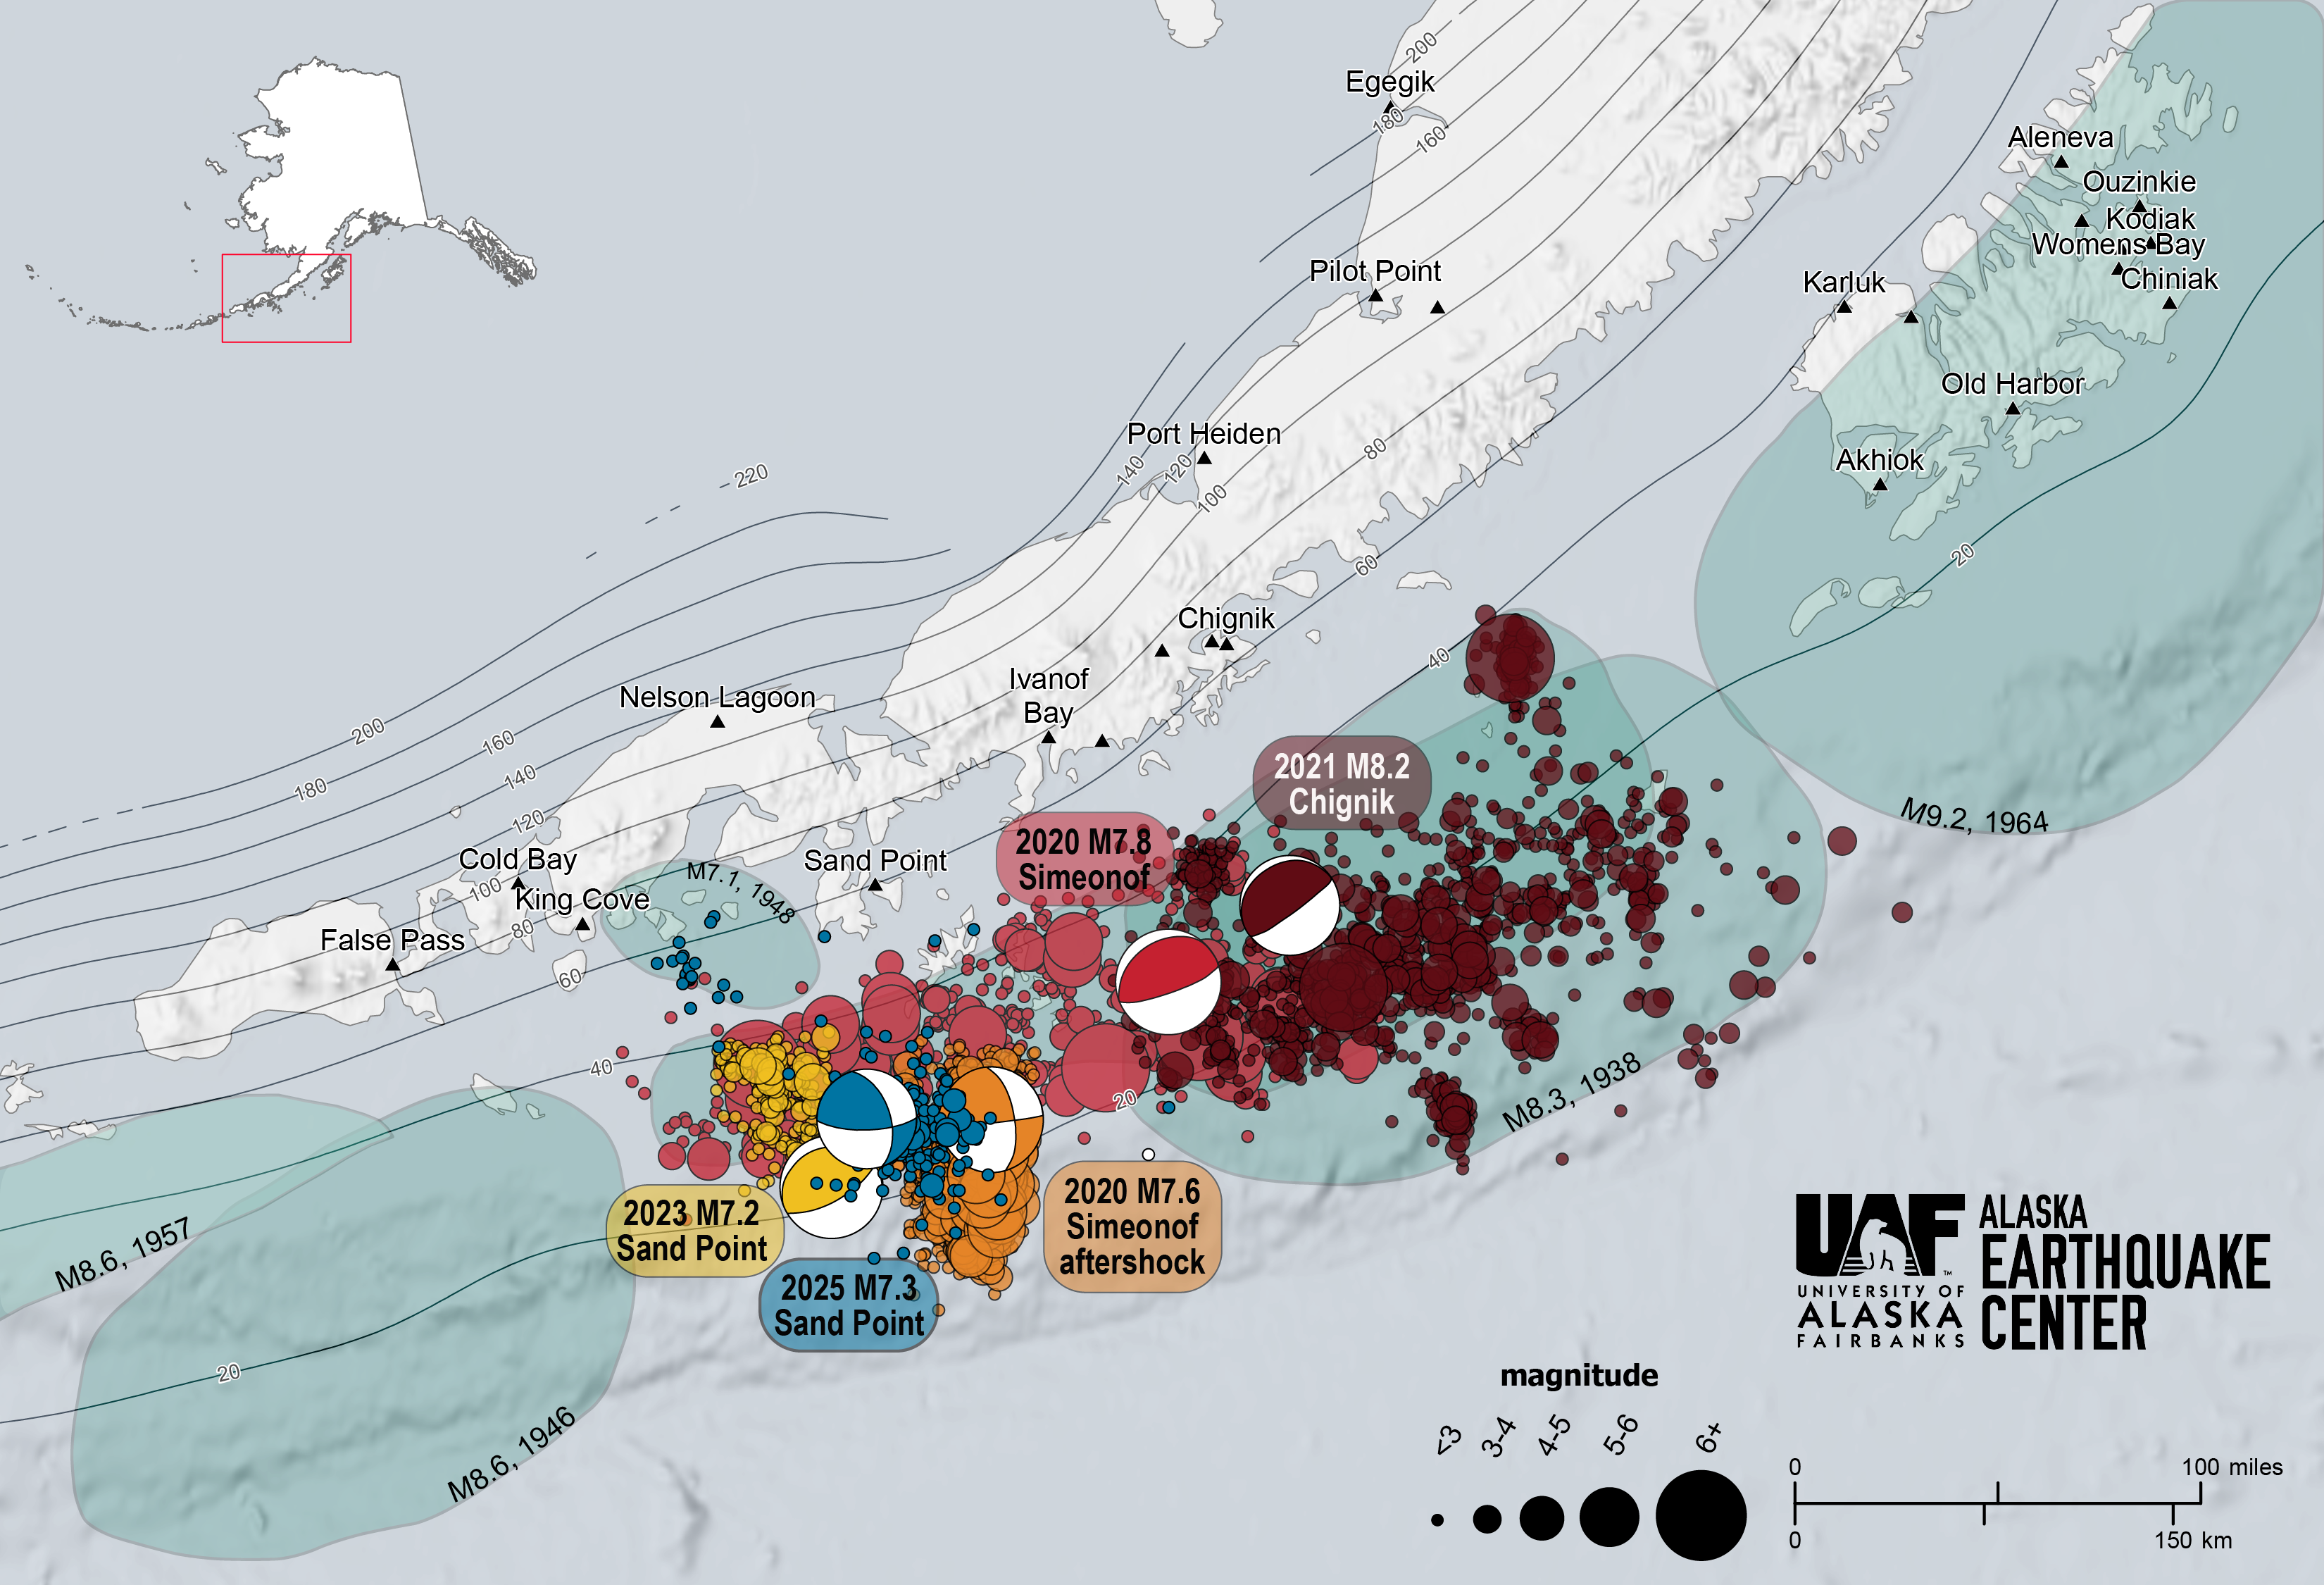
Figure 2. The July 16, 2025 magnitude 7.3 earthquake (blue focal mechanism "beachball") is the fifth earthquake larger than magnitude 7 to occur in this region since 2020. Colored dots show aftershock clusters for each earthquake, black triangles are seismic stations. (Click on map to enlarge.)
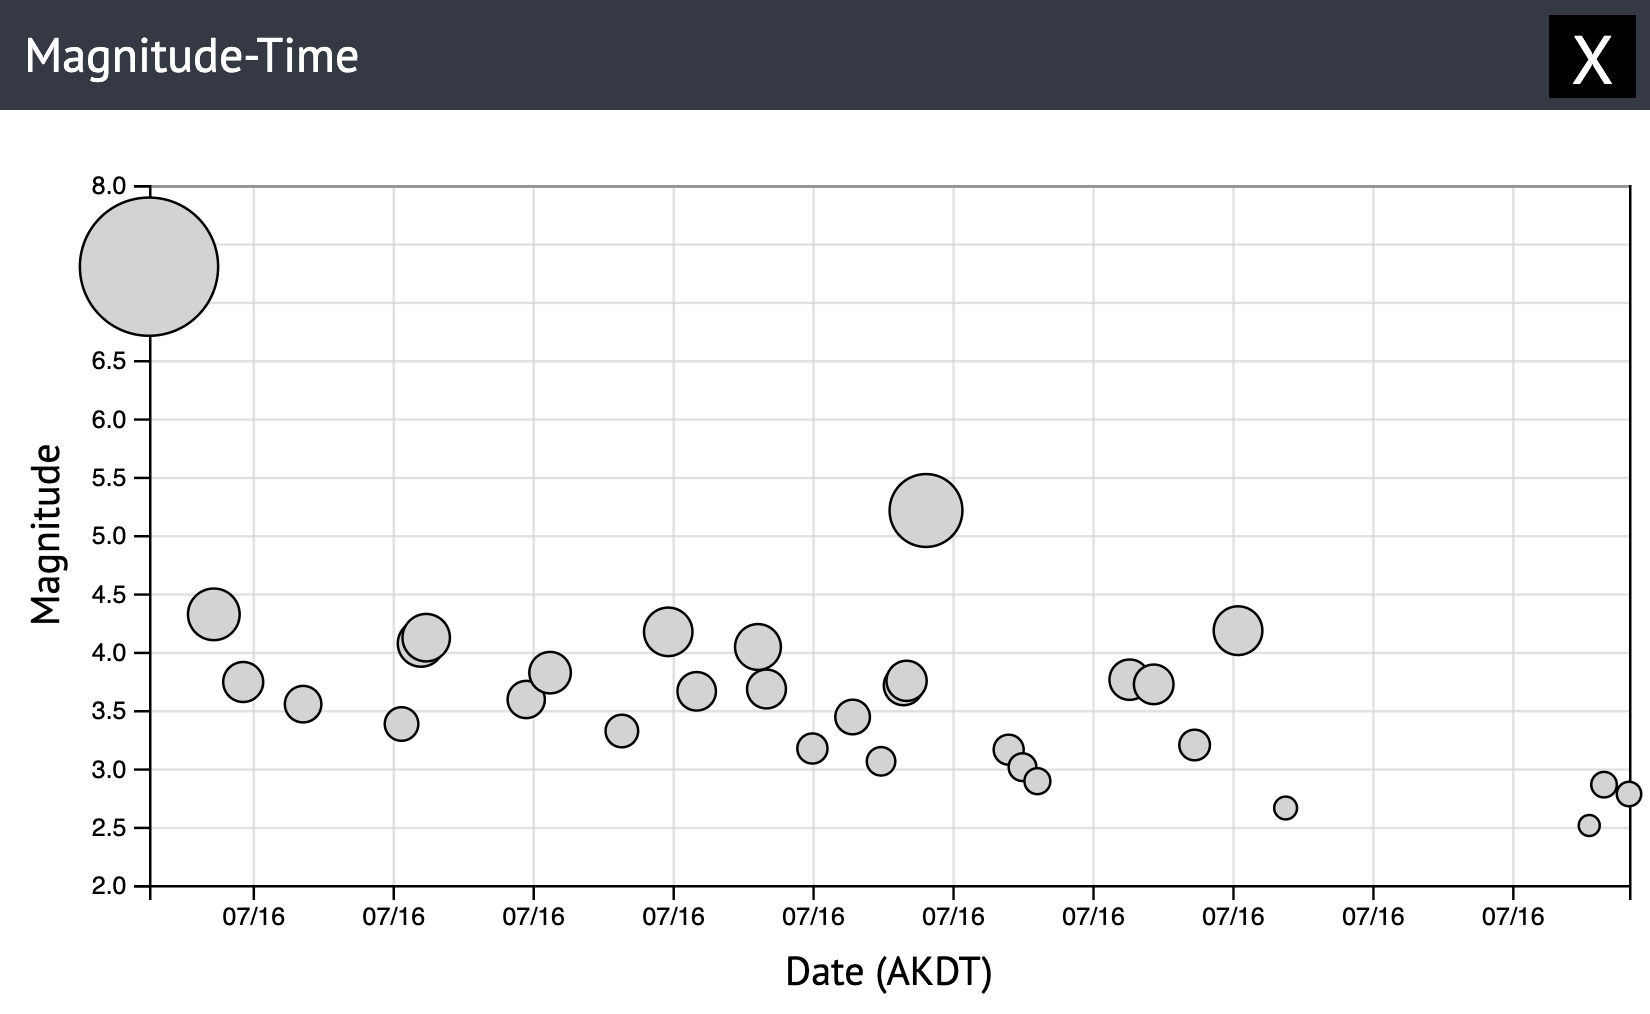
Figure 3. In the first three hours after the M7.3, we detected nearly 40 aftershocks, with seven above magnitude 4 and the largest a magnitude 5.2.
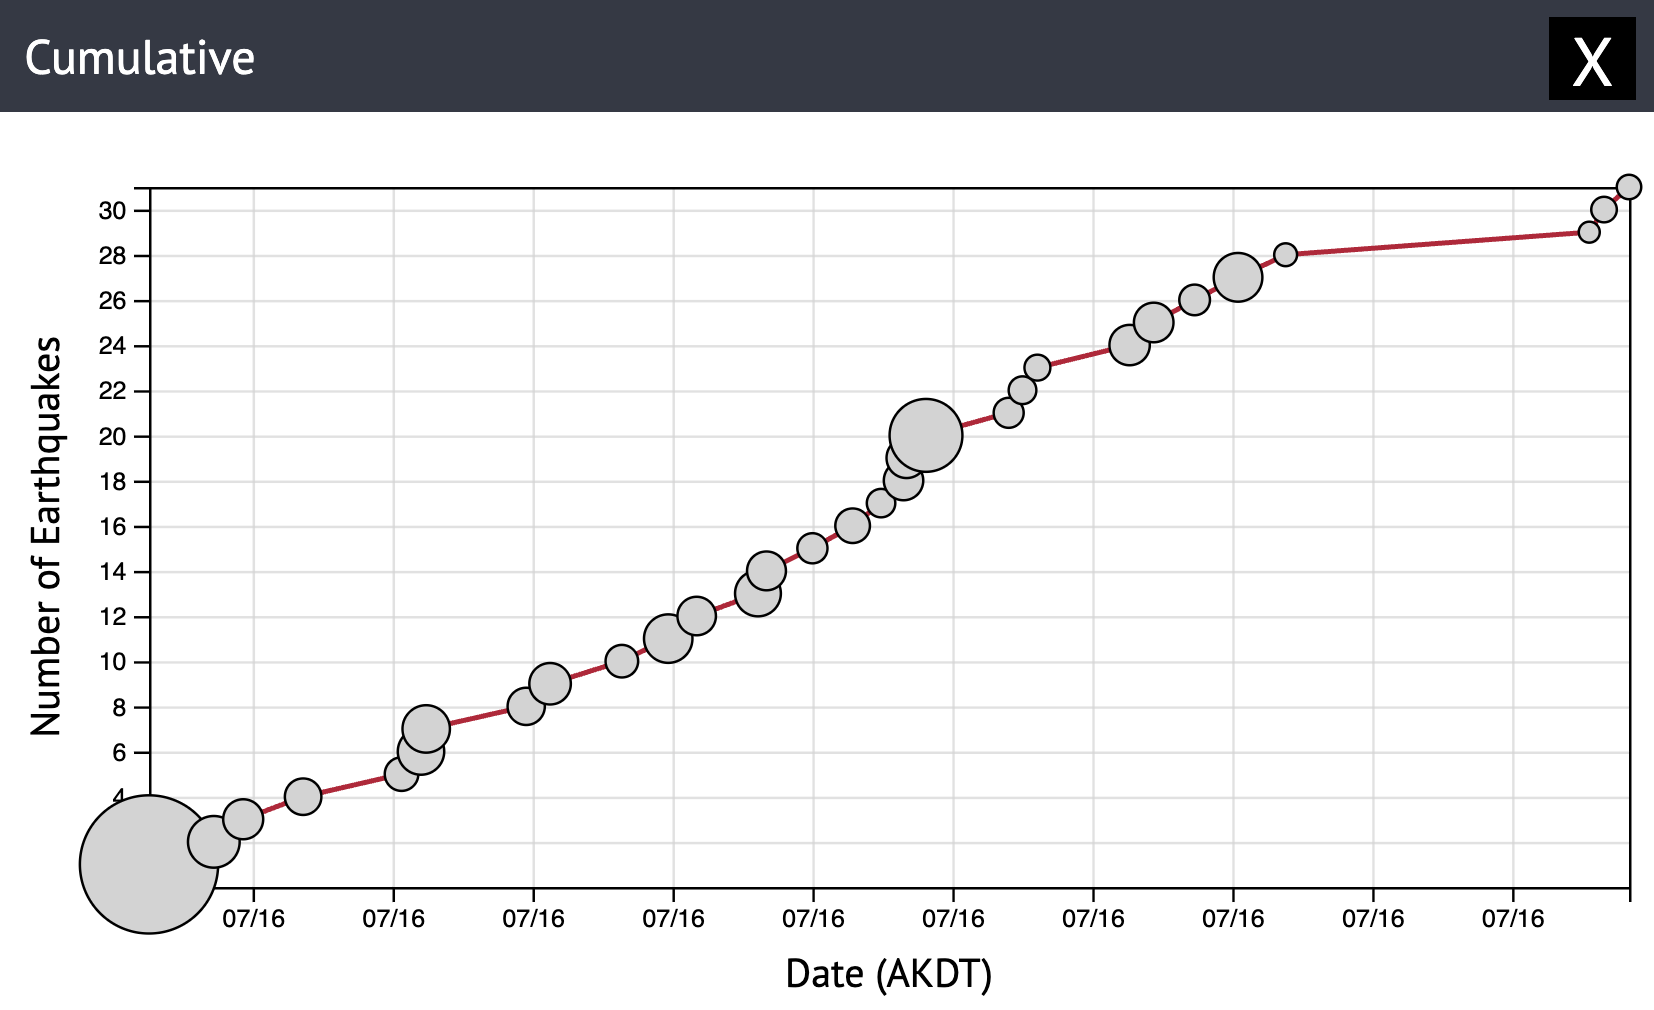
Figure 4. The magnitude 7.3 earthquake generated tens of aftershocks in the first few hours.
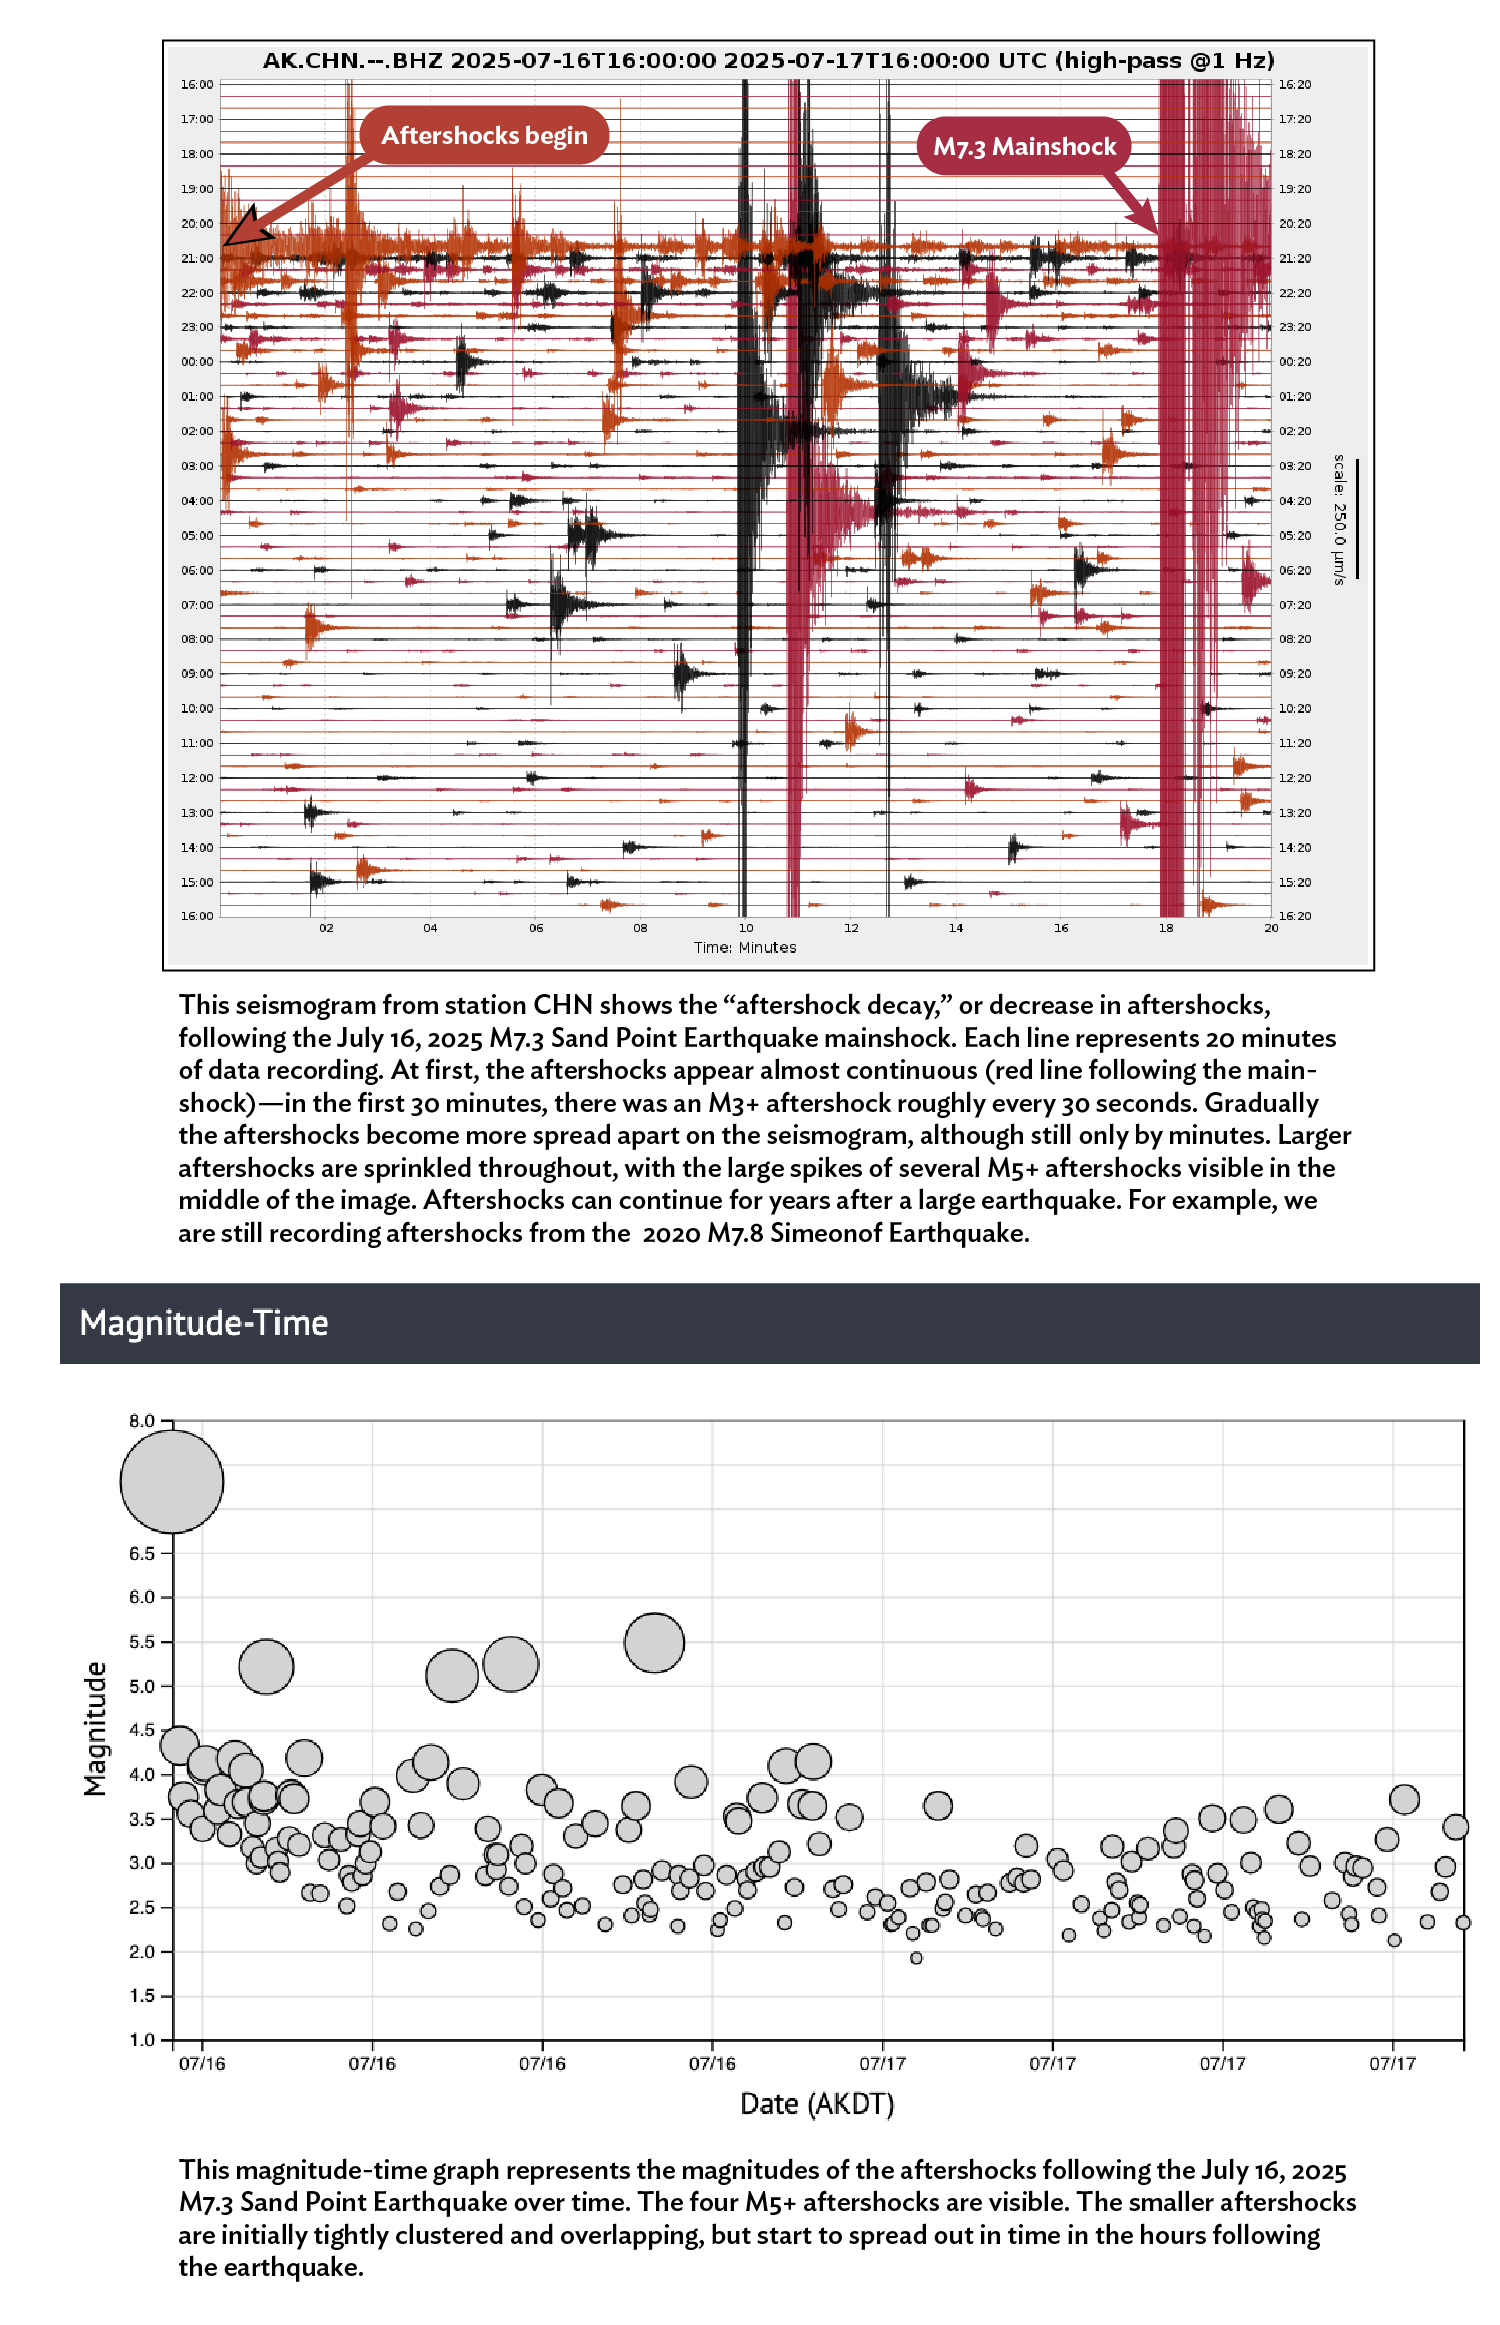
Figure 5. Aftershocks for the first day after the M7.3 Sand Point Earthquake. (Top) This seismogram from station CHN shows the “aftershock decay,” or decrease in aftershocks, following the July 16, 2025 M7.3 Sand Point Earthquake mainshock. Each line represents 20 minutes of data recording. At first, the aftershocks appear almost continuous (red line following the mainshock)—in the first 30 minutes, there was an M3+ aftershock roughly every 30 seconds. Gradually the aftershocks become more spread apart on the seismogram, although still only by minutes. Larger aftershocks are sprinkled throughout, with the large spikes of several M5+ aftershocks visible in the middle of the image. Aftershocks can continue for years after a large earthquake. For example, we are still recording aftershocks from the 2020 M7.8 Simeonof Earthquake.
(Bottom) This magnitude-time graph represents the magnitudes of the aftershocks following the July 16, 2025 M7.3 Sand Point Earthquake over time. The four M5+ aftershocks are visible. The smaller aftershocks are initially tightly clustered and overlapping, but start to spread out in time in the hours following the earthquake.