
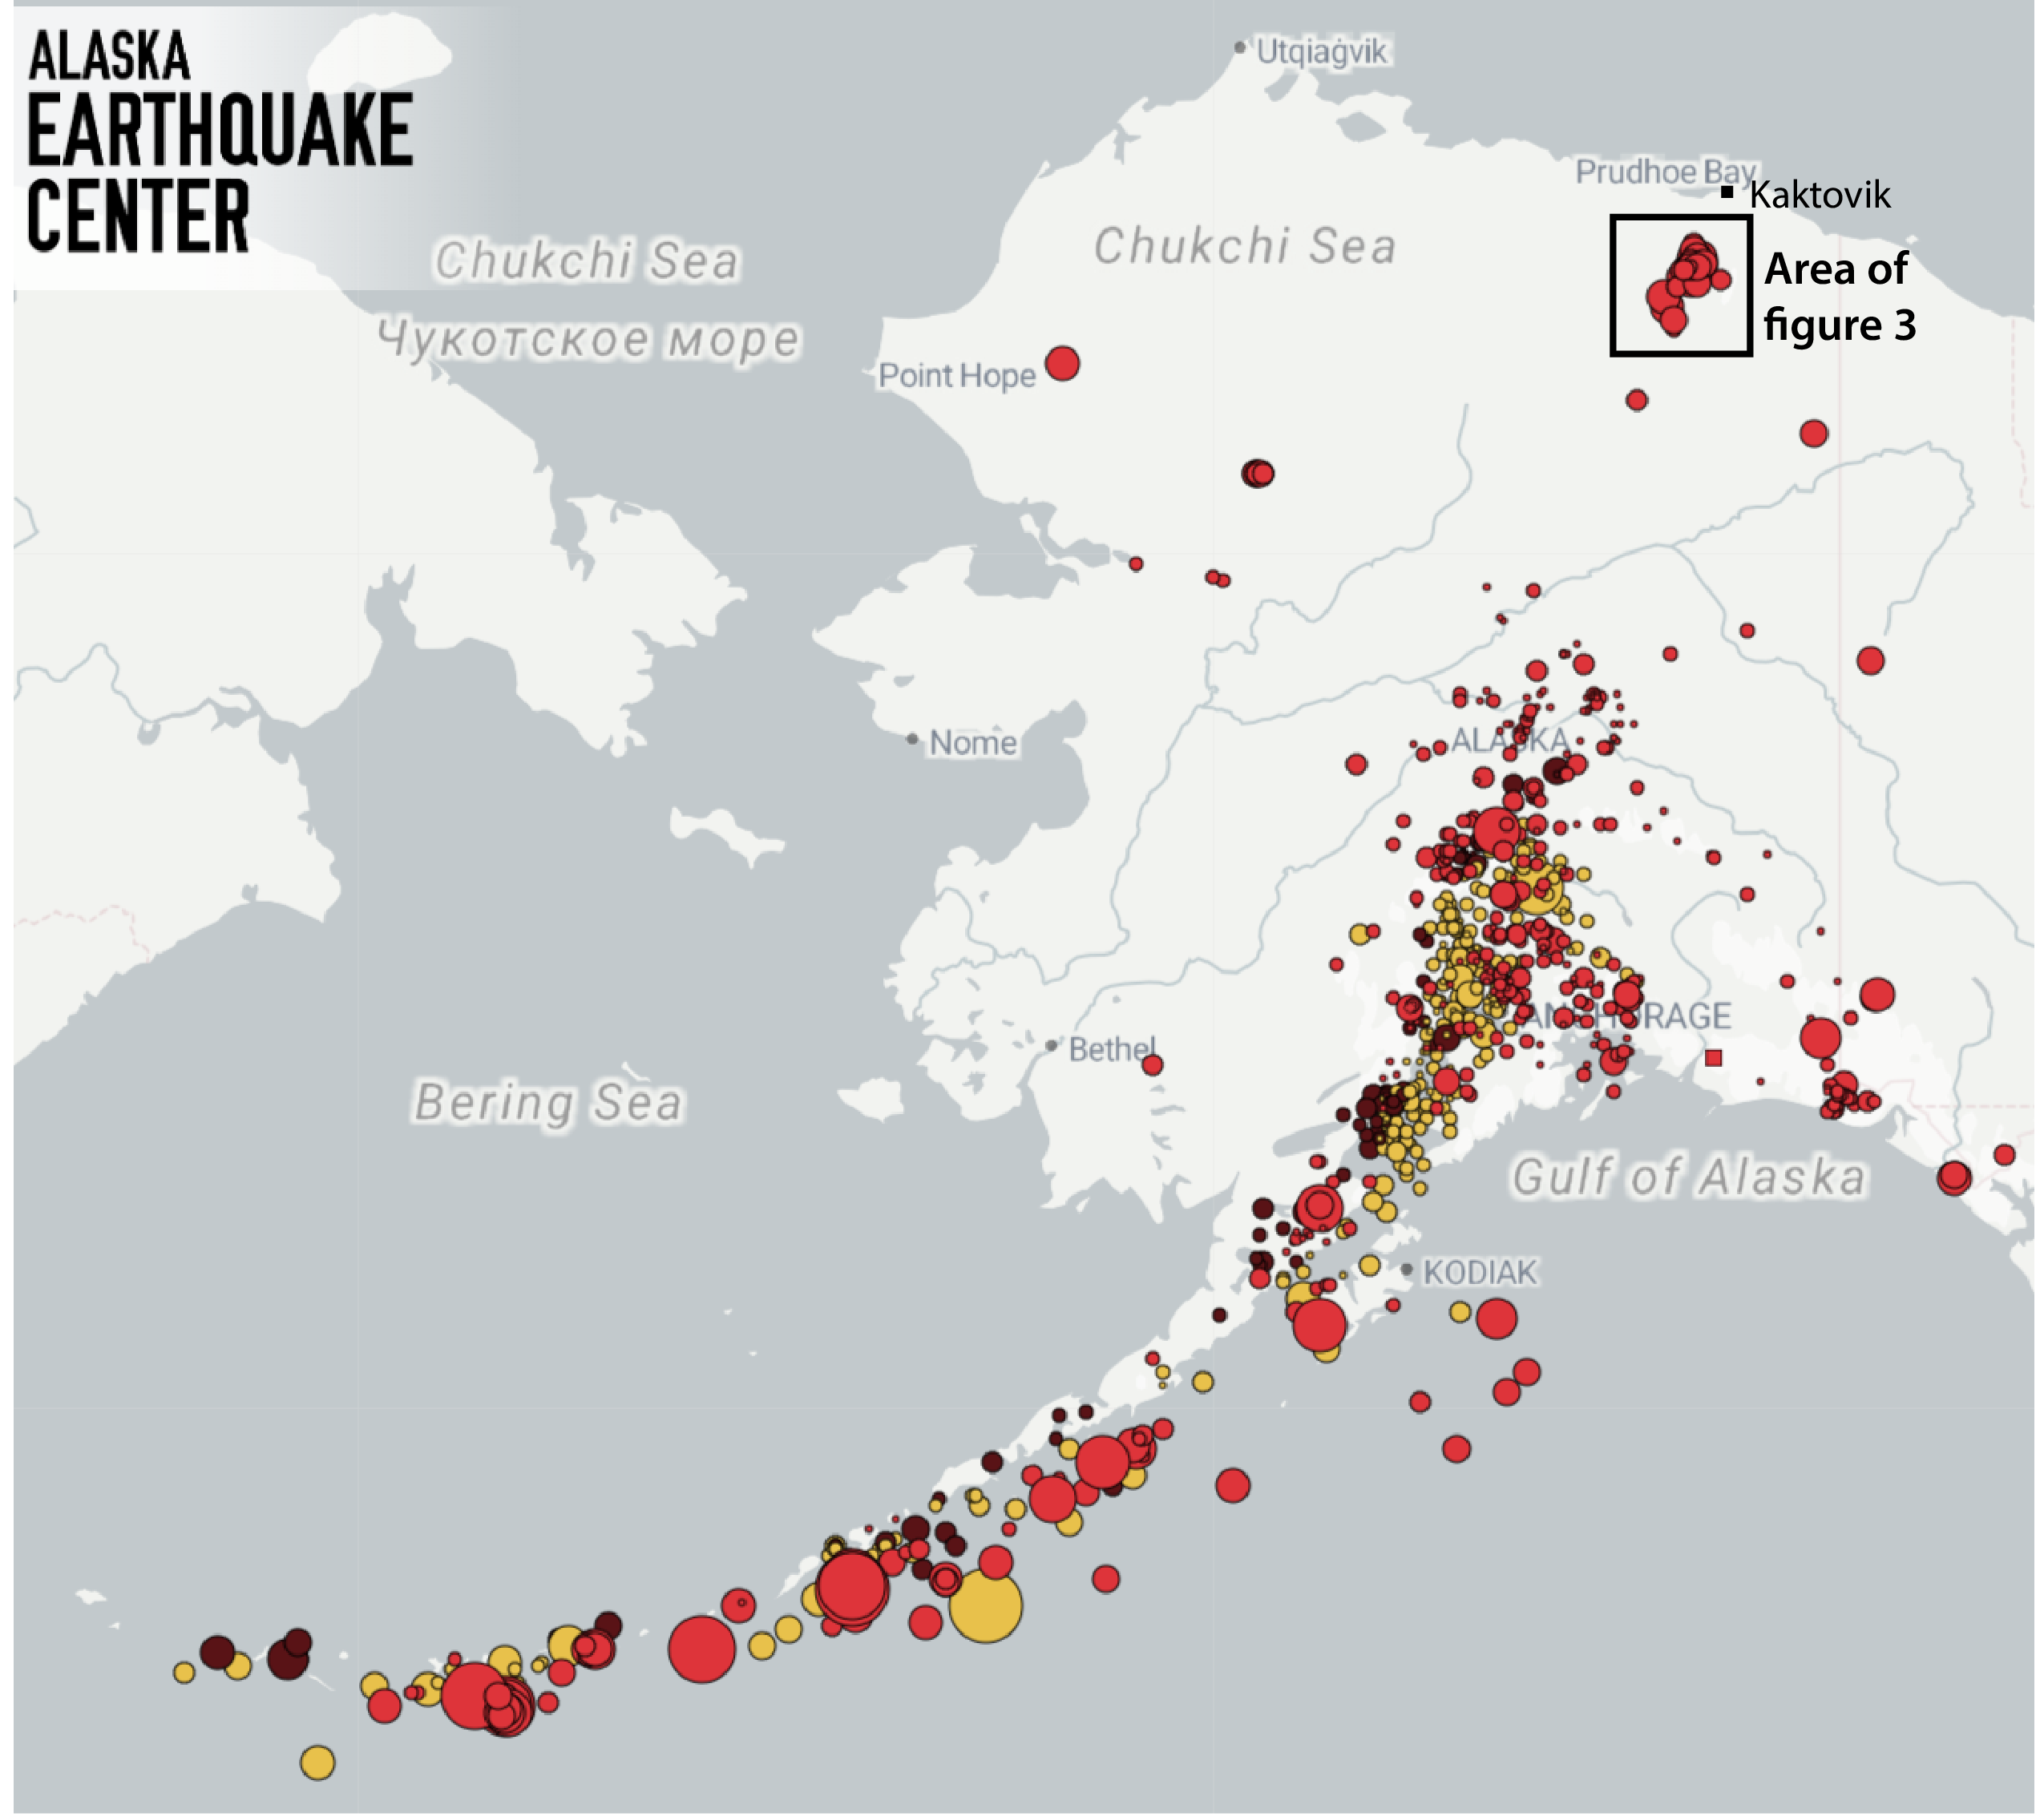
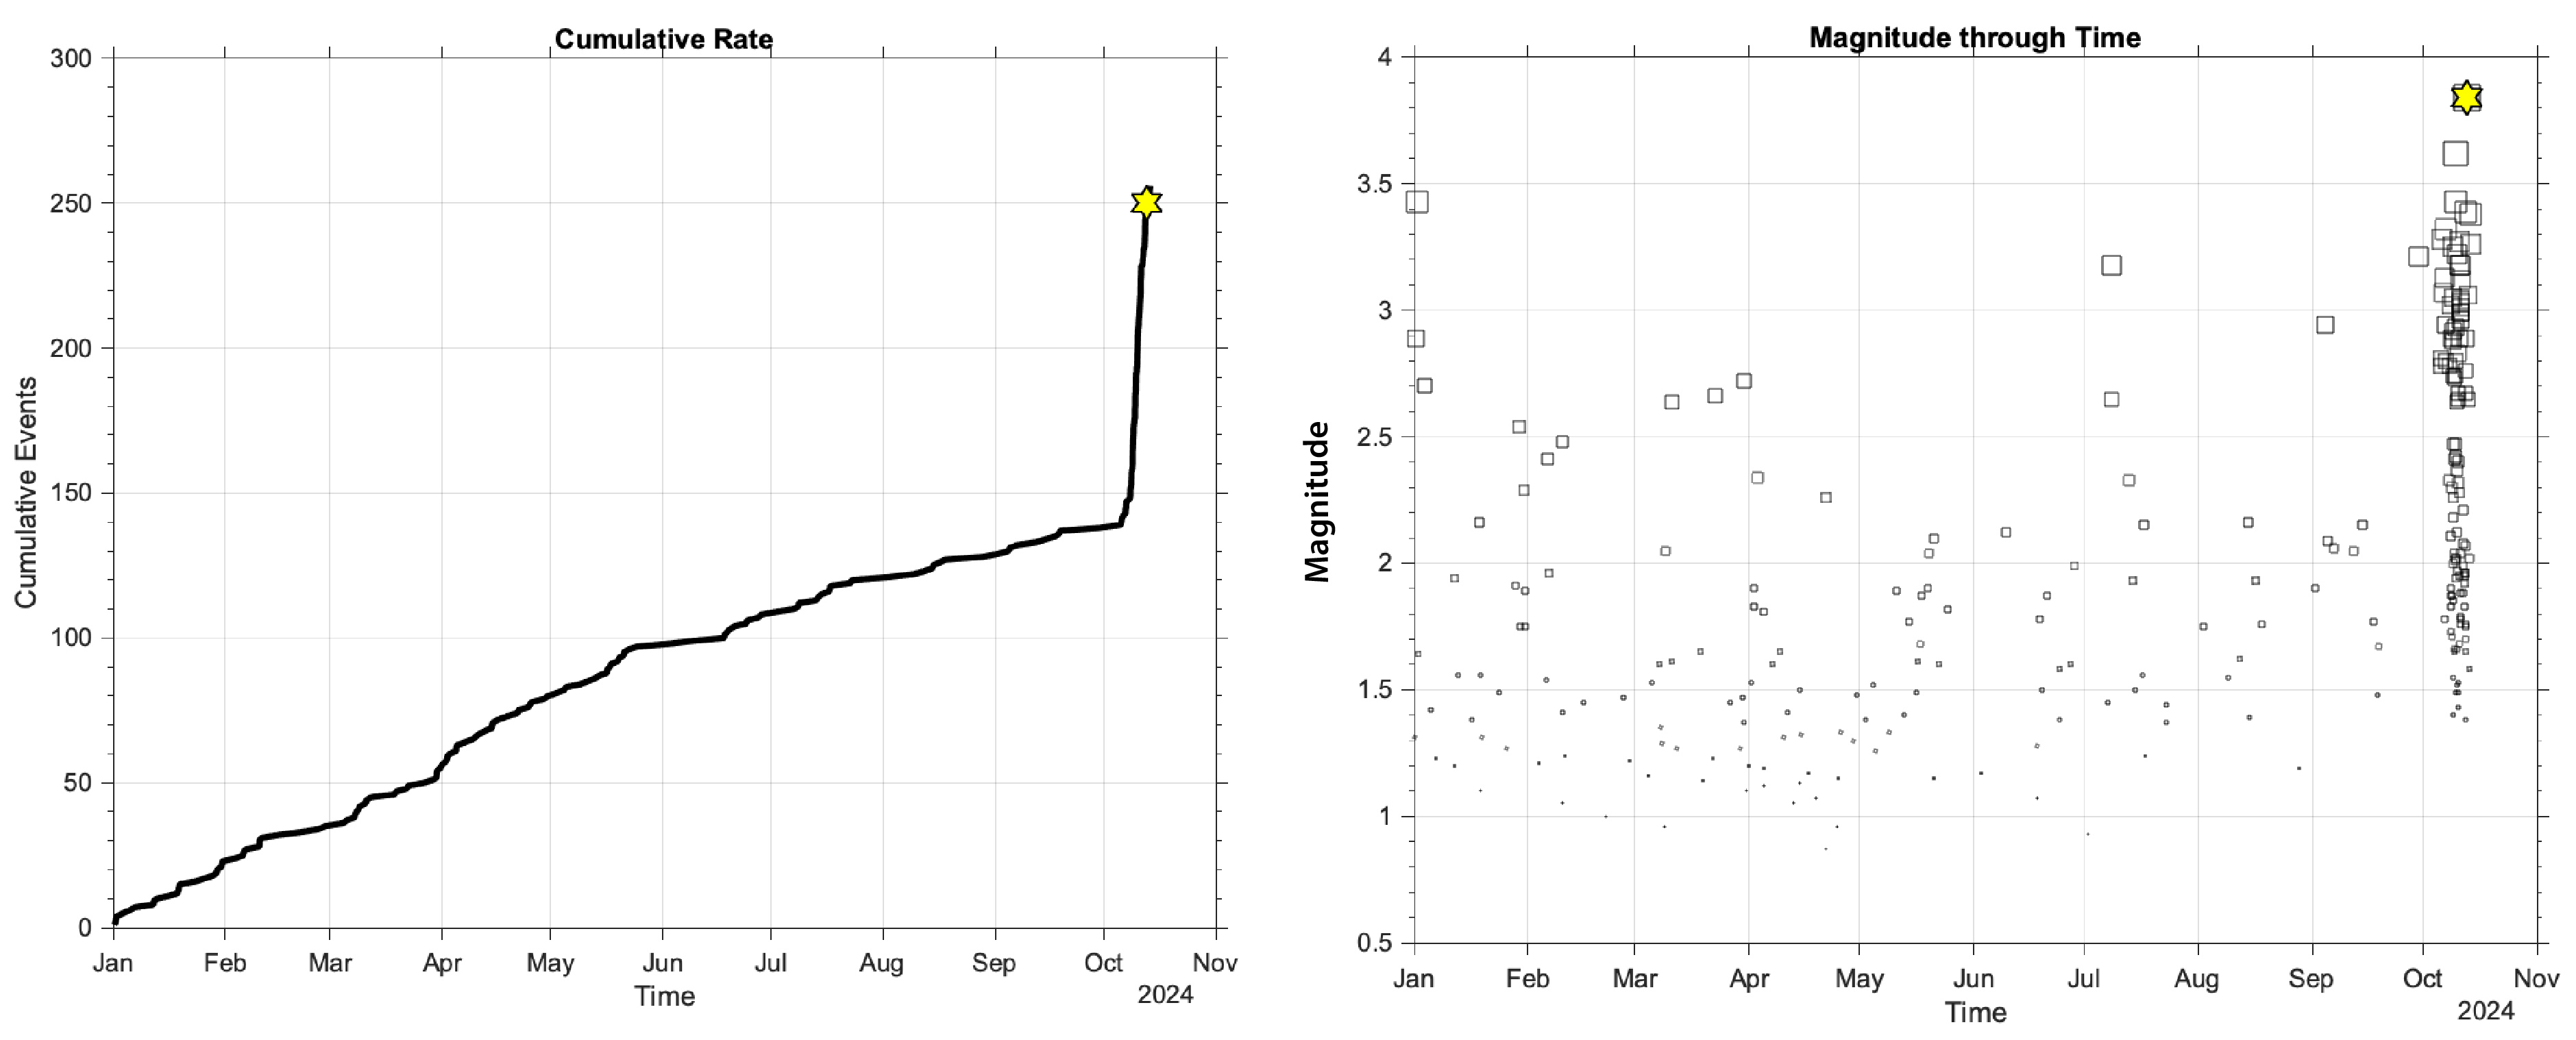


In early October, we detected a notable increase in earthquake activity about 50 miles south of Kaktovik in the northeastern corner of Alaska (Figure 1). This new cluster of events (Figure 2) is distinct and could be part of an emerging swarm that we are keeping an eye on. The expansion in our seismic network in 2019–20 in parts of the state that previously had lesser coverage (Figure 3) has allowed us to better capture seismic swarms like these.
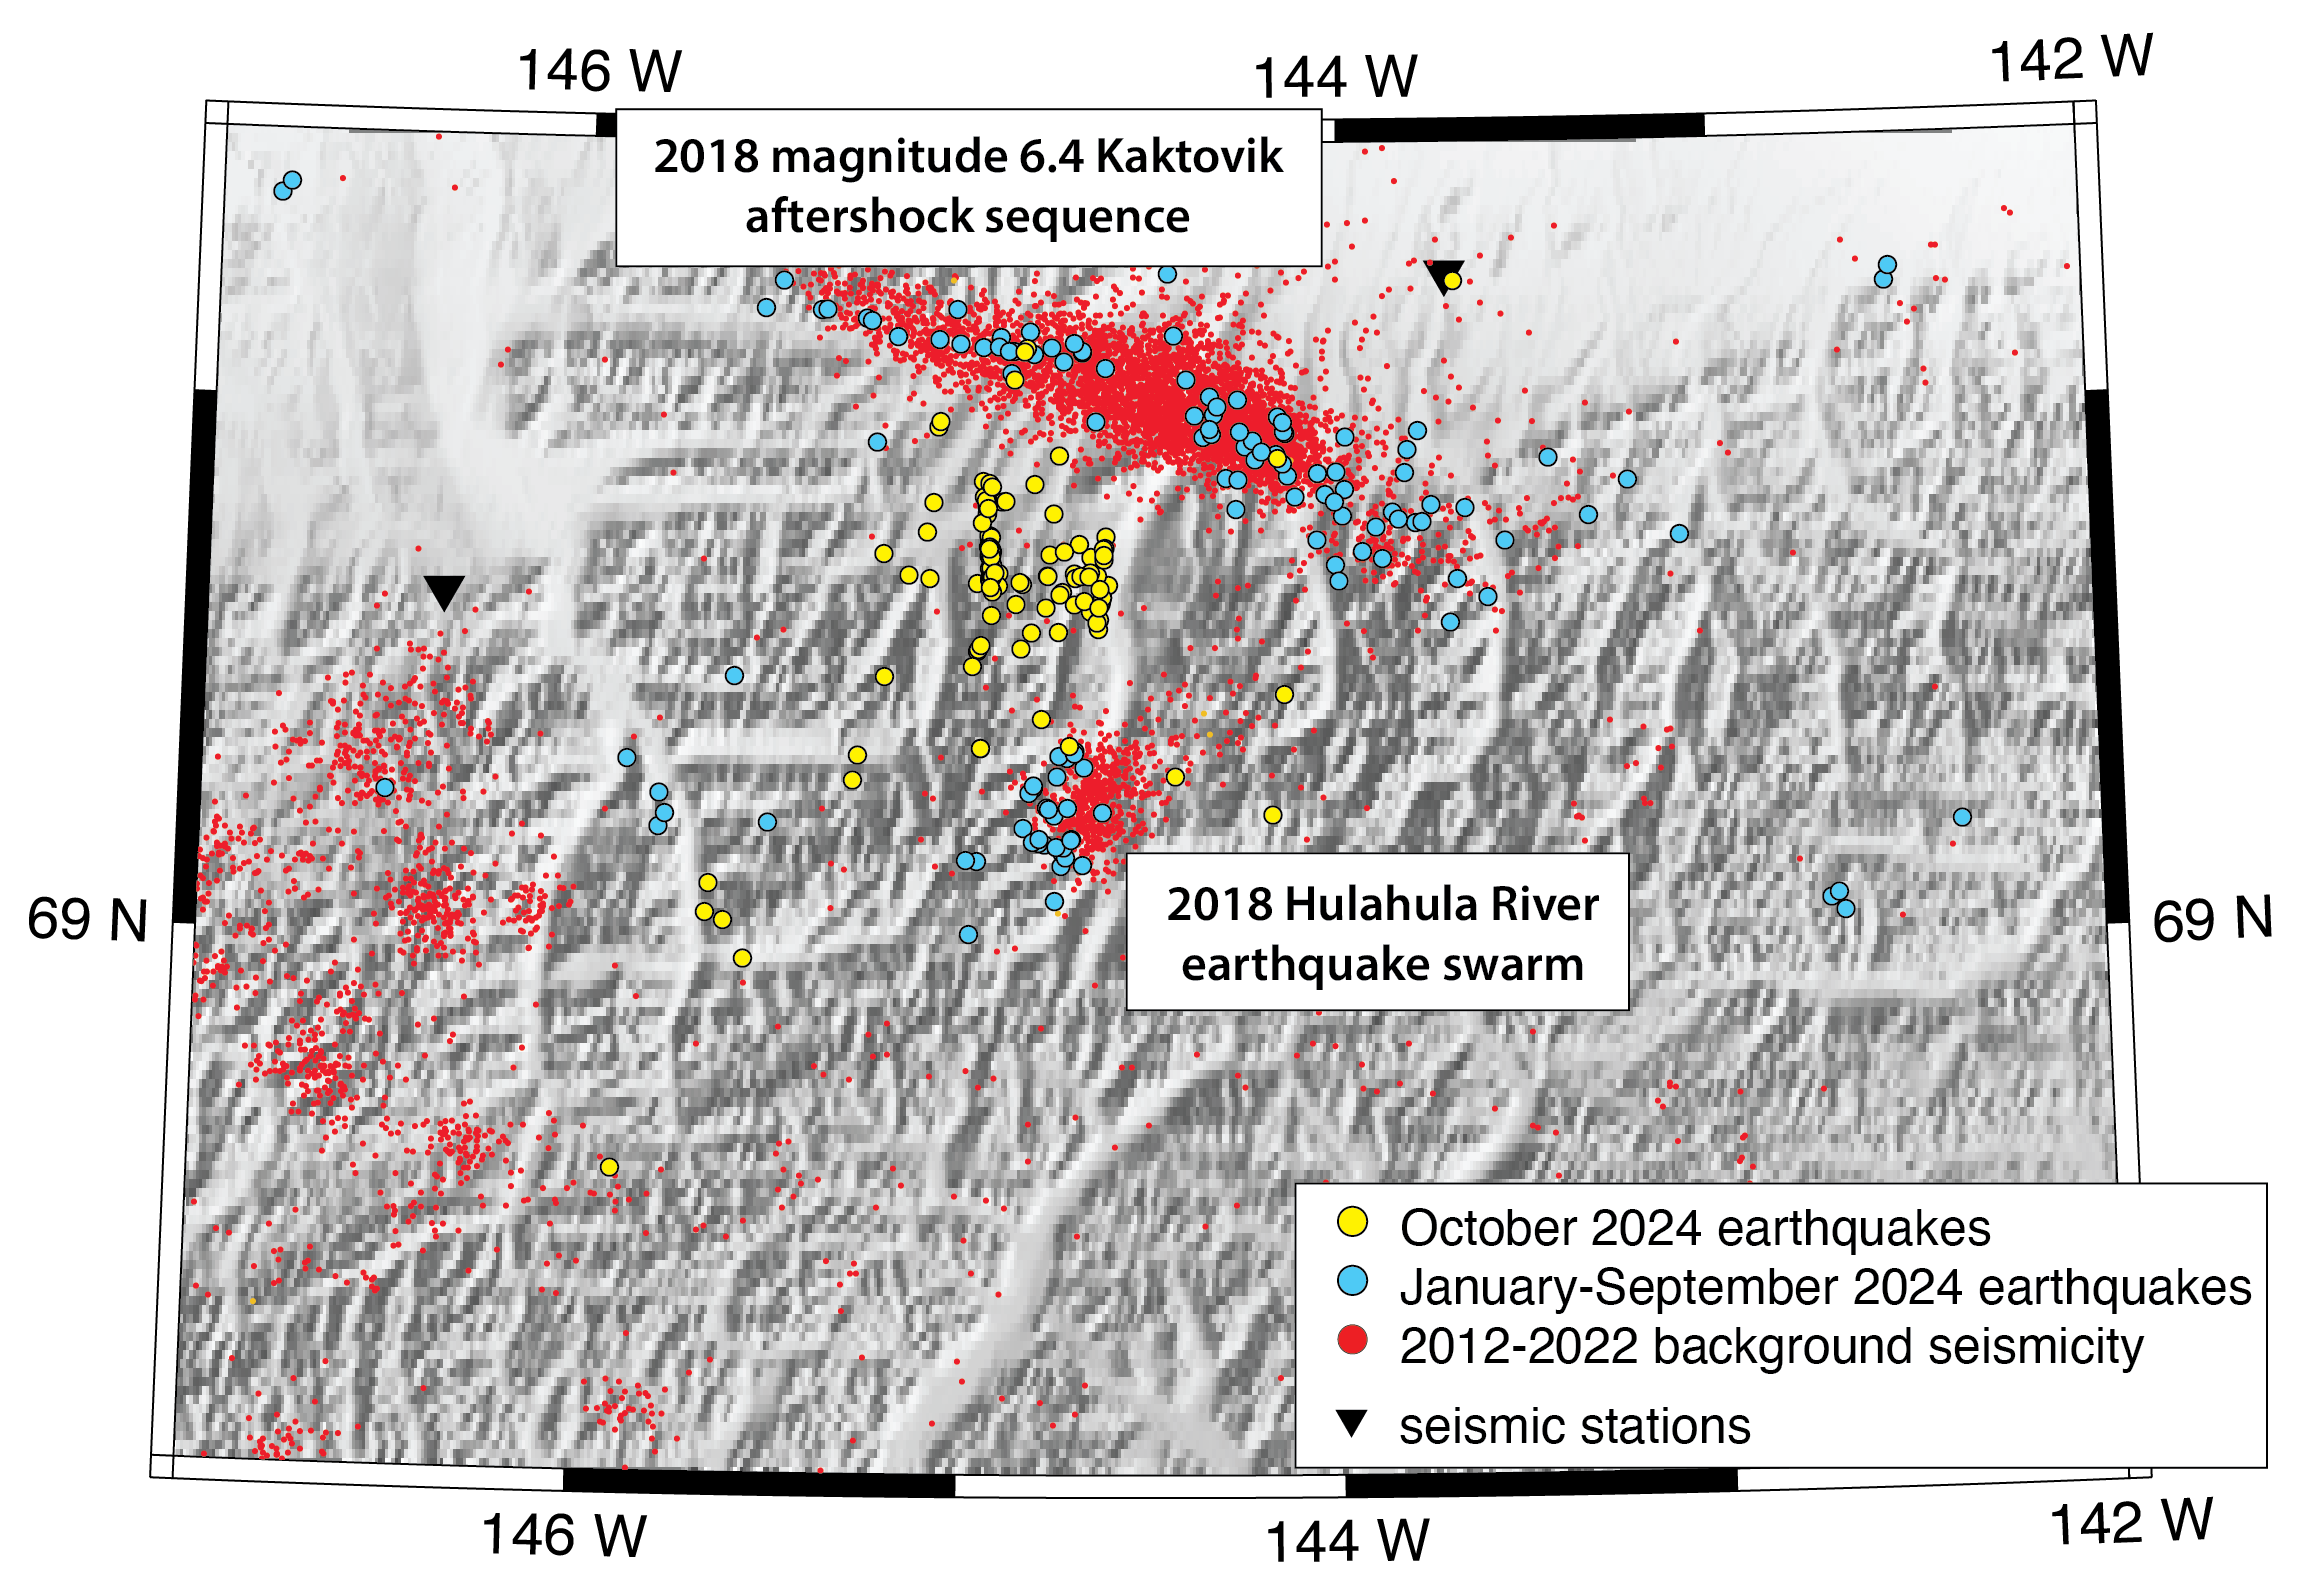
While this area is not typically known for large earthquakes, there have been a few notable previous events, shown in Figure 3:
(1) The 2018 M6.4 Kaktovik earthquake and aftershock sequence.
AEC research seismologist Ezgi Karasözen helped describe the area's potential for damaging earthquakes in one of the few papers published on northern Brooks Range seismicity. In the paper, the team says, “The northeastern Brooks Range has been characterized as an area of low to moderate seismic hazard, but these earthquakes illustrate the potential for larger, possibly destructive events in a region earmarked for rapid resource development.”
(2) The 2018 Hulahula River earthquake swarm, briefly shown in this report https://core.ac.uk/reader/286999910, experienced periods of unrest in 2013 and 2019.
Earthquake swarms are common in the Brooks Range region. They can last for weeks, months or even years. You can read more about seismic swarms in our news story "What is an earthquake swarm?".
Generally speaking, earthquakes in the northern Brooks Range area are related to the forces that built the mountains. After the collisions that formed the mountain belt stopped, the area began “relaxing” outward, resulting in extensional and strike-slip faulting, which continues today.