A surprise twist in the quest for landslide warning signs
Beth Grassi

Gabrielle Davy’s graduate research, now published in a scientific paper, started out looking for seismic signals that were precursors to a landslide. The Barry Landslide is a creeping hazard located in the Barry Arm fjord of Prince William Sound. A massive section of the fjord wall, approximately 1.7 miles wide and rising about 1 mile (1.5 km) above the fjord, poses a landslide hazard. Identifying what a landslide precursor looks like in the seismic record would be an enormous step for keeping communities safe.

Davy and her co-authors manually sifted through a year's worth of the common seismic activity in Barry Arm—glacier calving, rockfalls, tectonic earthquakes—to look for anything unusual that could be a precursor to a landslide. The results were intriguing: A series of short, high-frequency seismic signals were a mysterious part of the mix. Dubbed “short-impulsive” or SI events, Davy described them as exhibiting “strong seasonal variability, increasing in rate from late summer to midwinter before ceasing abruptly in late winter or early spring.”

By examining the seismic data and comparing them to weather, infrasound (sound waves below the threshold of human hearing), and radar data, the researchers think the mysterious SI blips are linked to seasonal ice freezing and thawing within the bedrock.

The team used the different data types to eliminate possible causes of the strange little seismic signals: 

In the seismic data, the SI events only appeared on one station, and not its partner across the fjord. This indicates a very local event.

The infrasound instrument array did not detect the SI events, indicating possible below-ground movement, not above-ground motion such as avalanches or rockfalls.

Weather station data measured air temperatures. The increase in SI event activity in late summer through midwinter seemed to align with freeze/thaw conditions, when the temperature fluctuates between slightly above 32 degrees and slightly below 32 degrees. The authors’ hypothesis is that in those conditions, the water in cracks in the rock is freezing and thawing, creating the short impulsive signals. The sudden drop in SI activity matched with the warmer temperatures of spring and early summer, when the water temperature remains above freezing.

Slope movement can be tracked with satellite and terrestrial radar systems. The SI events sometimes increased even after slope movement stopped, and at one point the SI events occurred when there was no slope movement at all. This indicates the SI events were not related to shifts in the landslide area.  

Davy said, “These small seismic signals aren’t caused by the landslide itself, but they still matter. They appear to track seasonal freezing and water movement happening behind the slope, offering insight into hidden processes that affect stability.” Figuring out this small mystery will be a helpful tool in examining other potential landslide areas in Alaska.

Learn more about the research:

Study Searches for Landslide Clues in Seismic Signals from Alaska’s Barry Arm


Learn more about the Earthquake Center’s landslide monitoring:

What it takes to catch a landslide in Alaska (Landslide monitoring, starting with Barry Arm, then expanding)

New detection method aims to warn of landslide tsunamis

Major Landslide in Southeast Alaska Fjord (2025 Tracy Arm landslide, with image of precursors)

Two women setting up digital cameras on tripods, with glacier and mountains in the left background.

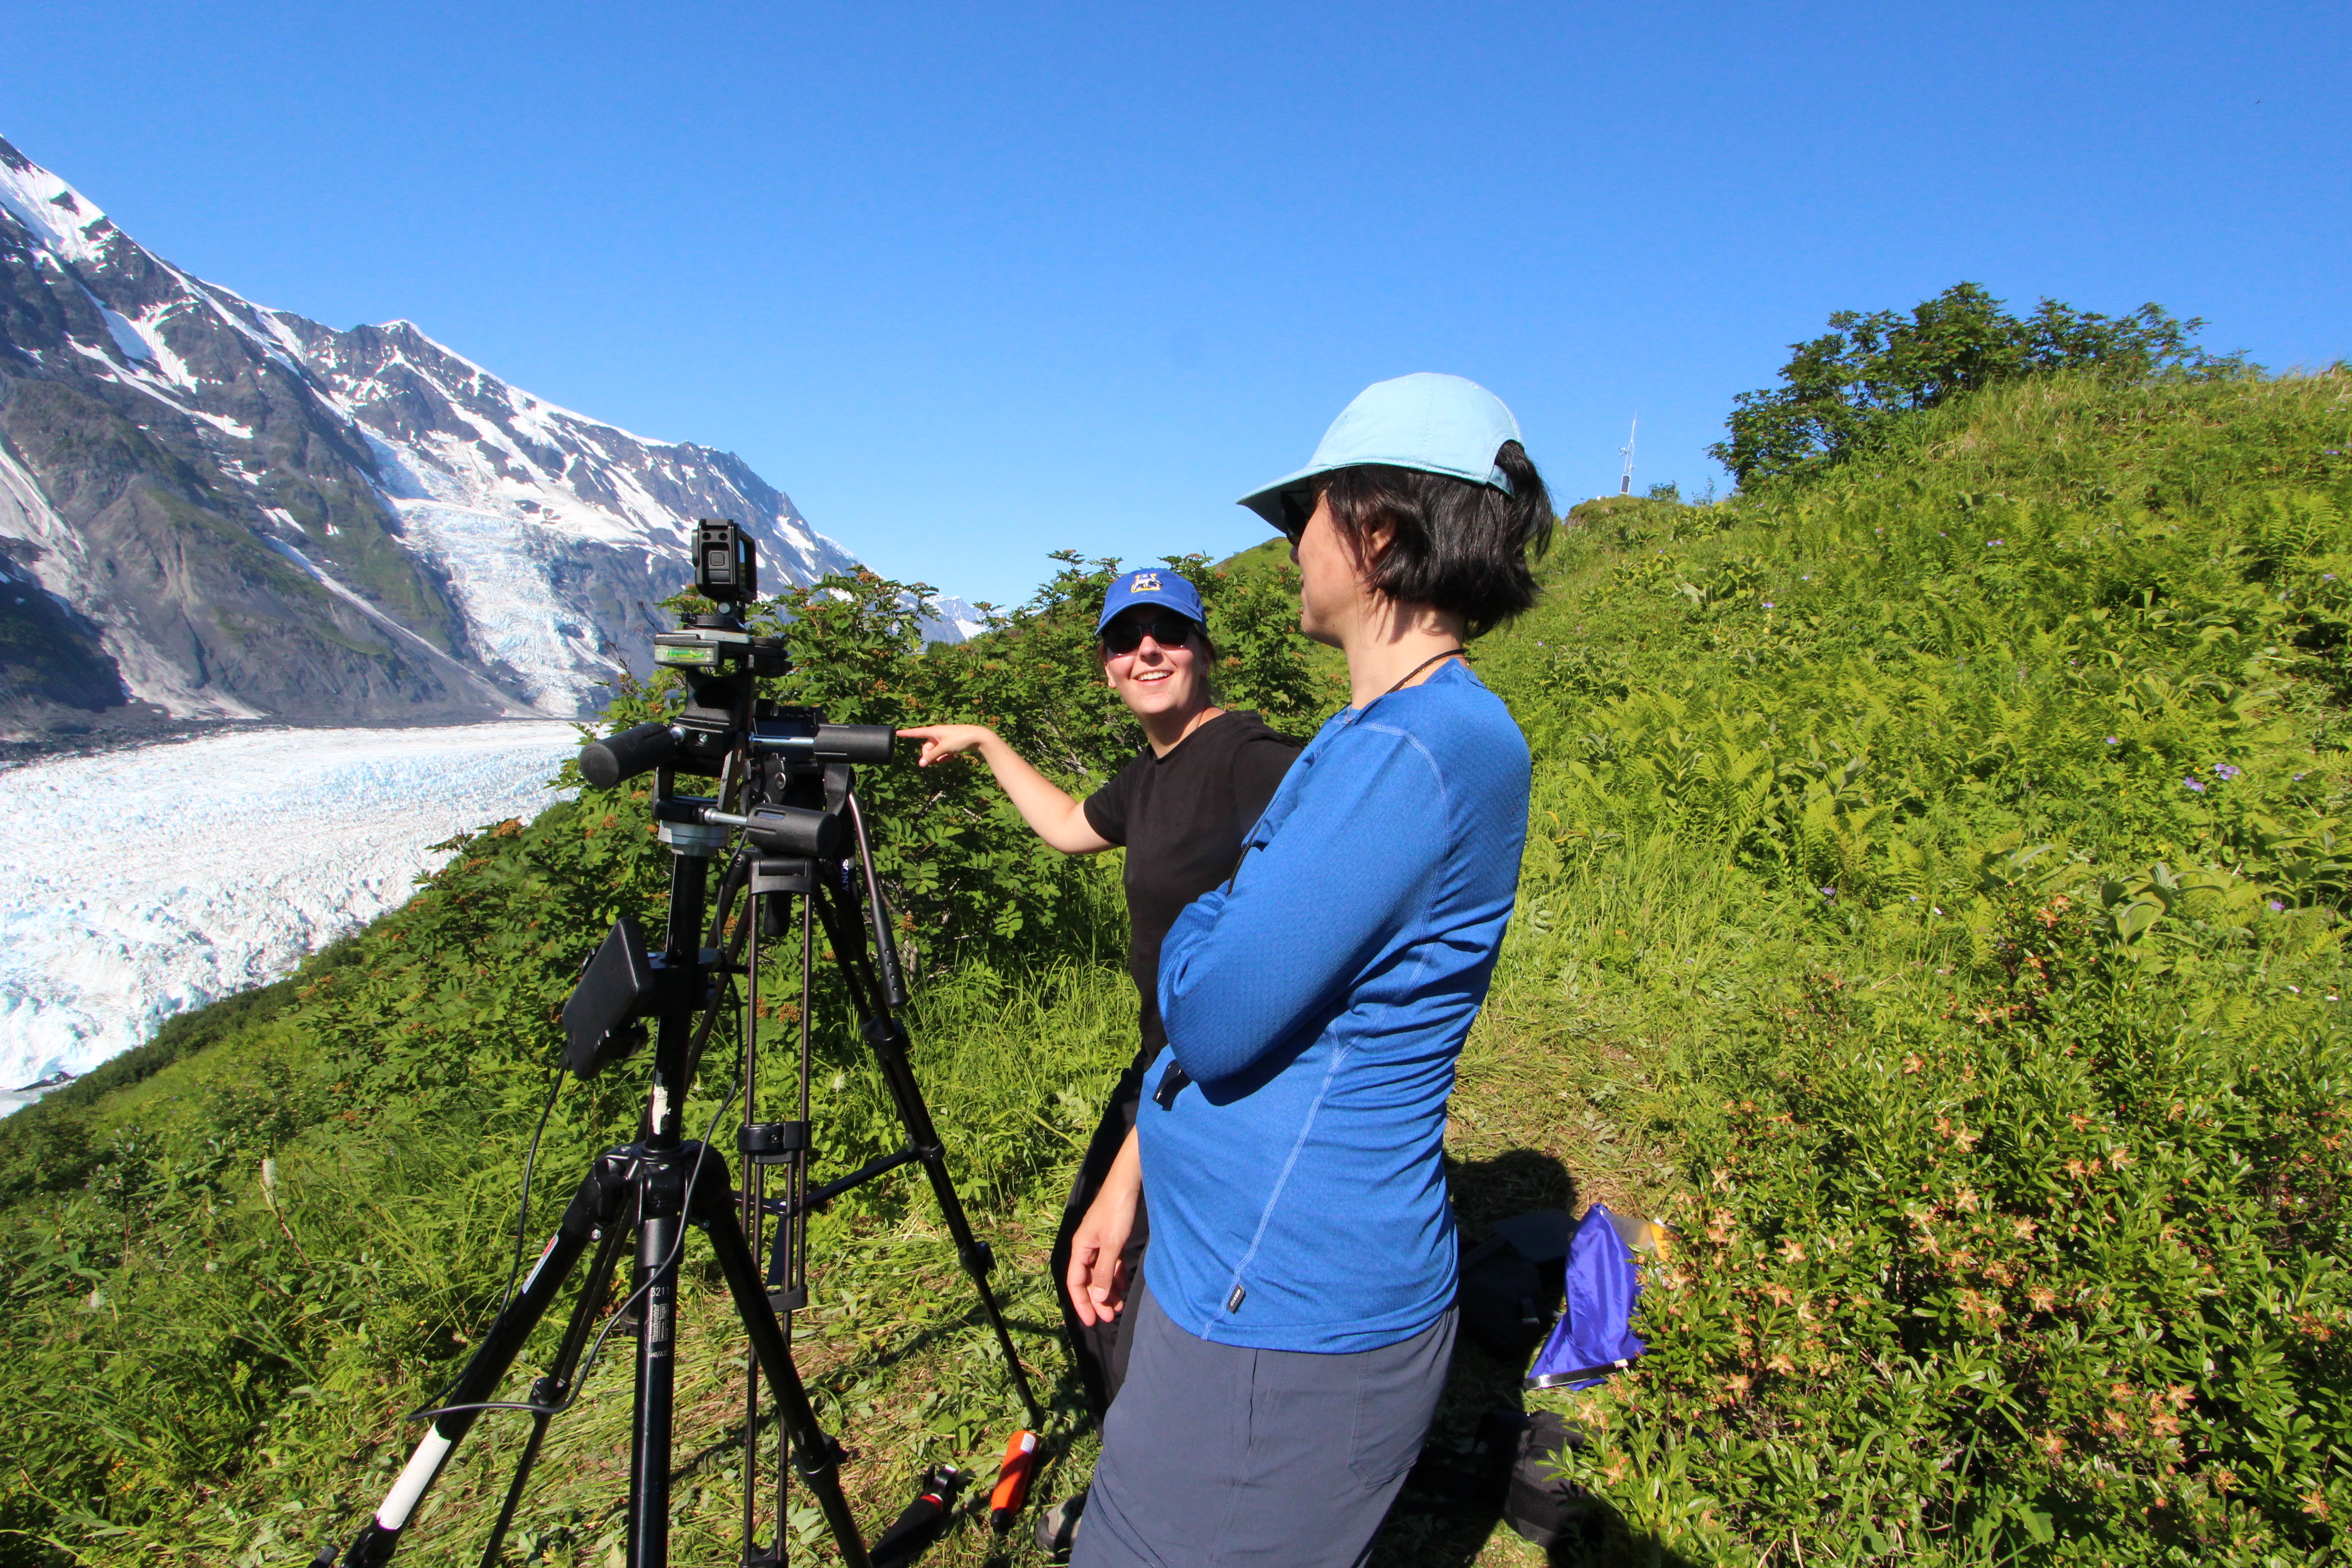
Figure 1. Gabrielle Davy and Earthquake Center researcher Ezgi Karasözen monitoring the Barry Landslide and Barry Glacier during a field visit, taking notes on observations of rockfalls on the slide area and glacier calving. 


Woman sitting on top of seismic station hut with solar panels, installing new equipment.

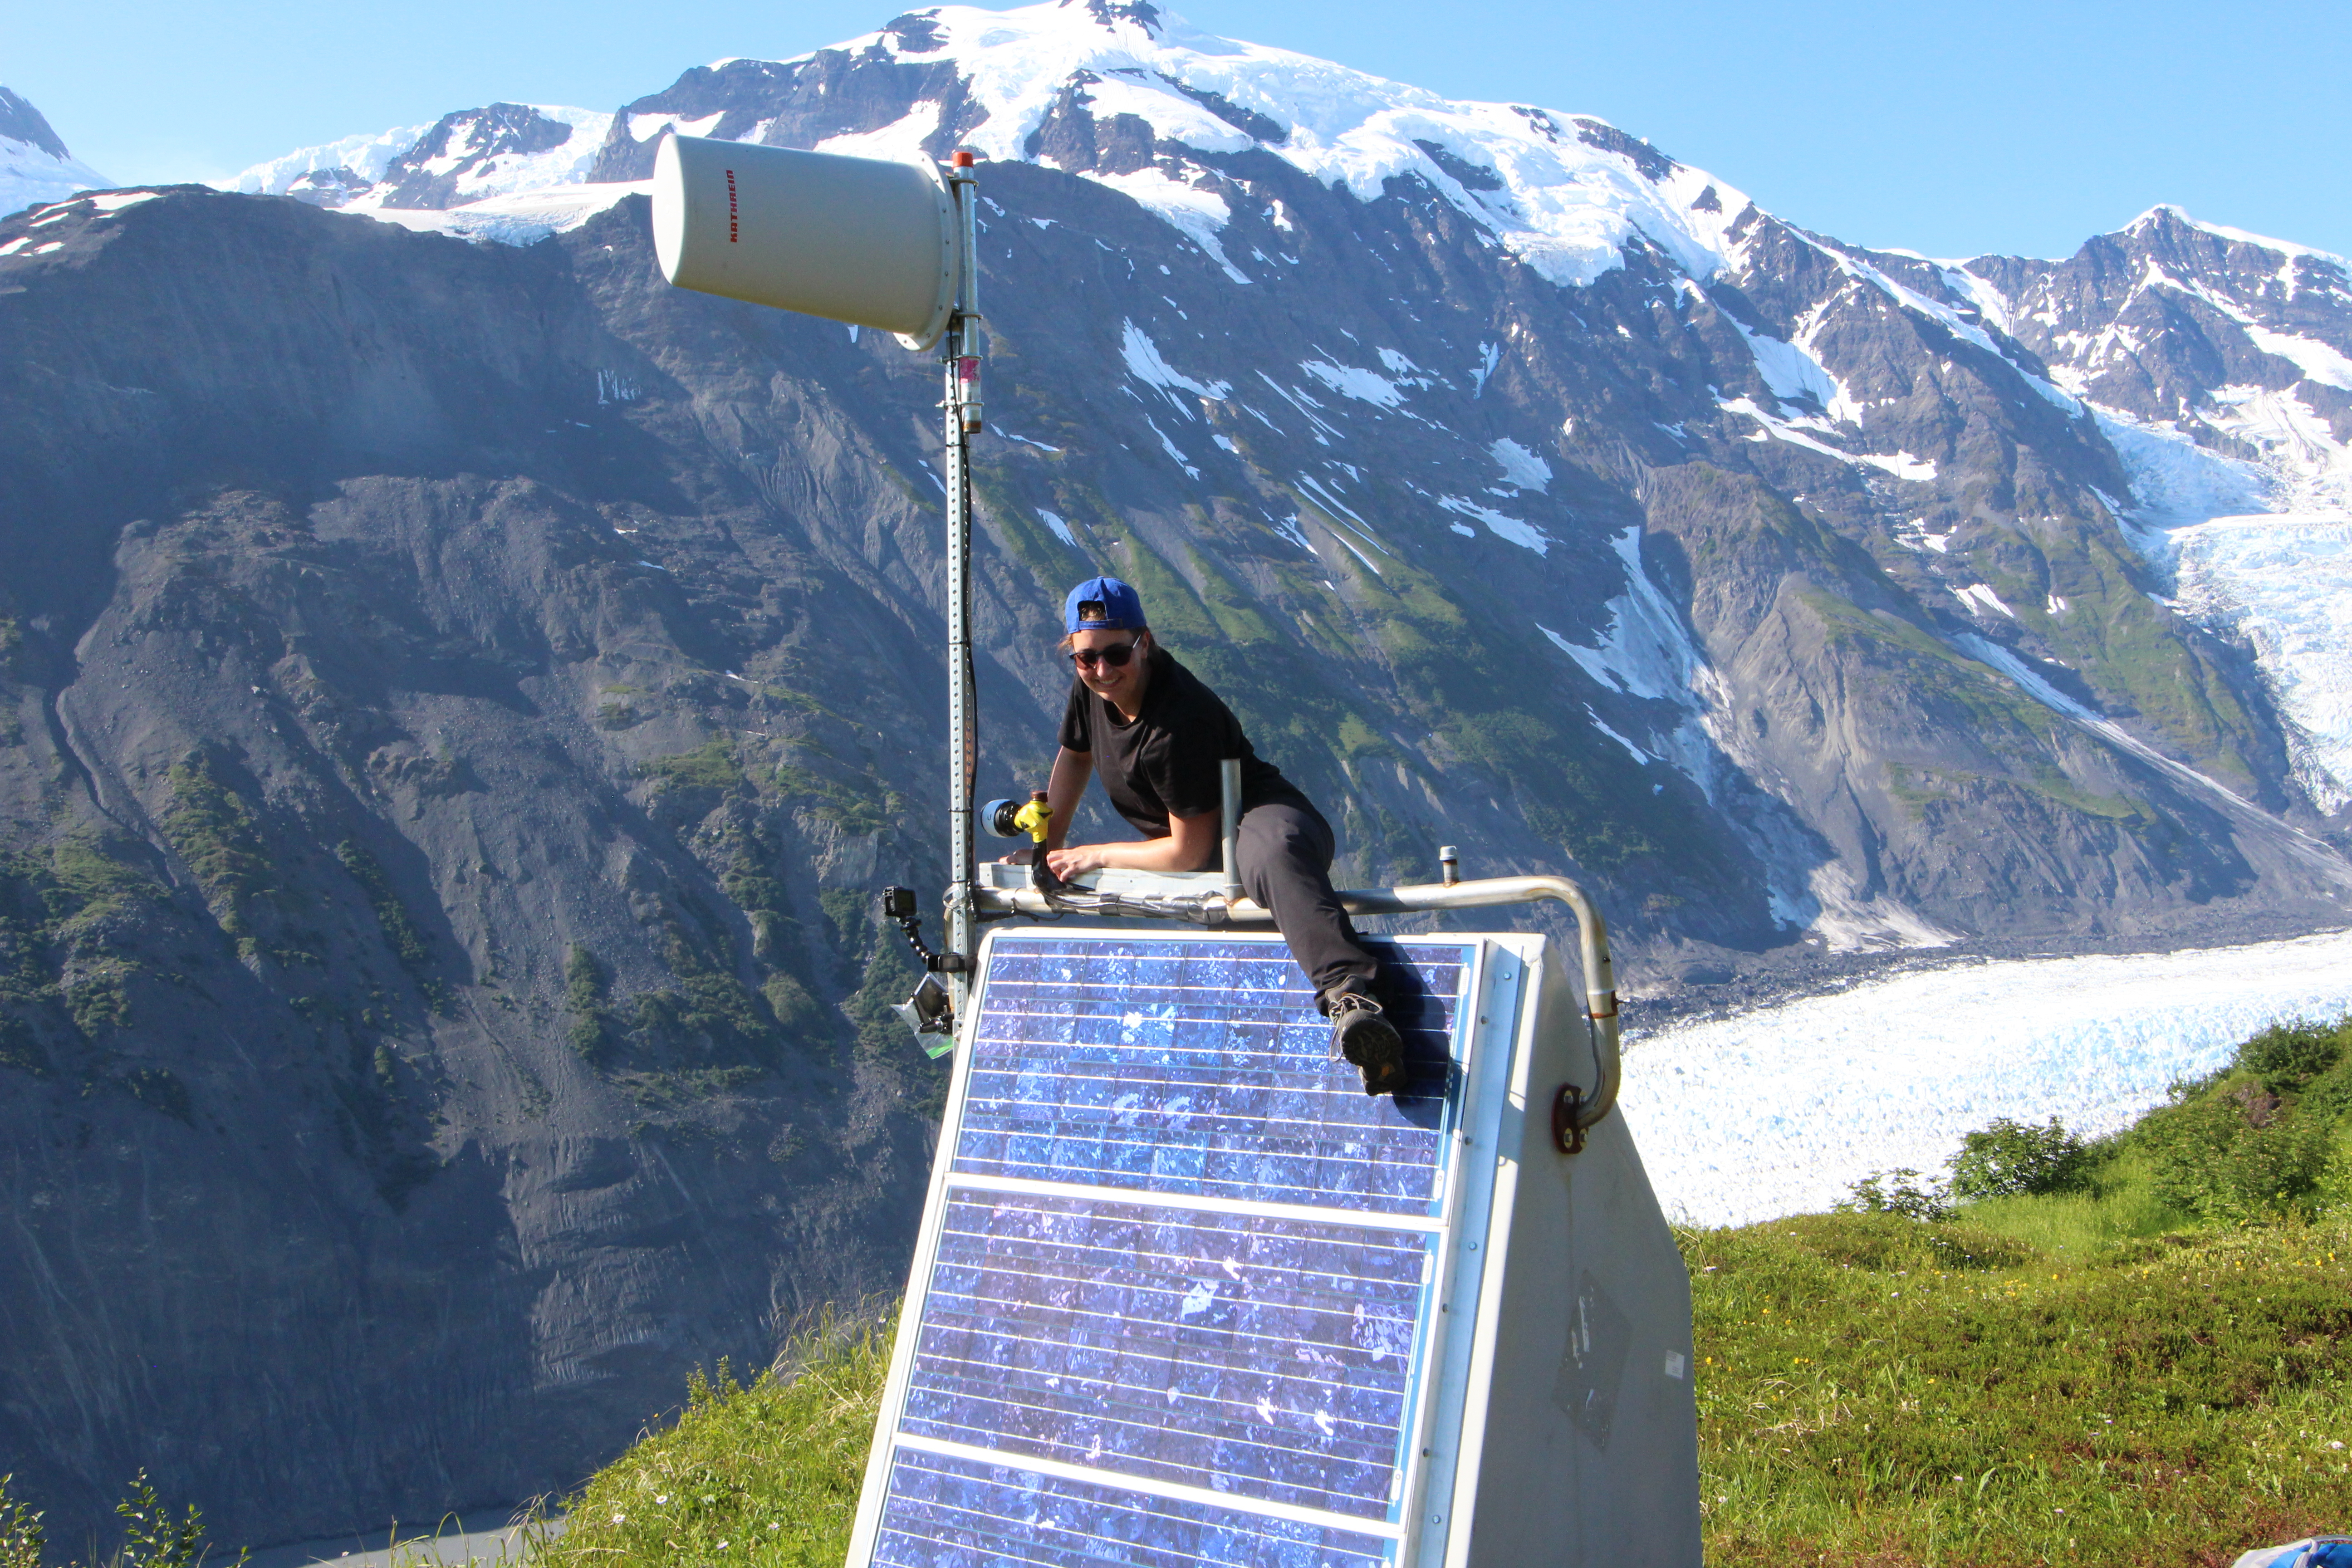
Figure 2. Davy attaching a temporary go-pro camera to record slope movement overnight on station BAE. The landslide slope is in the background on the left. 


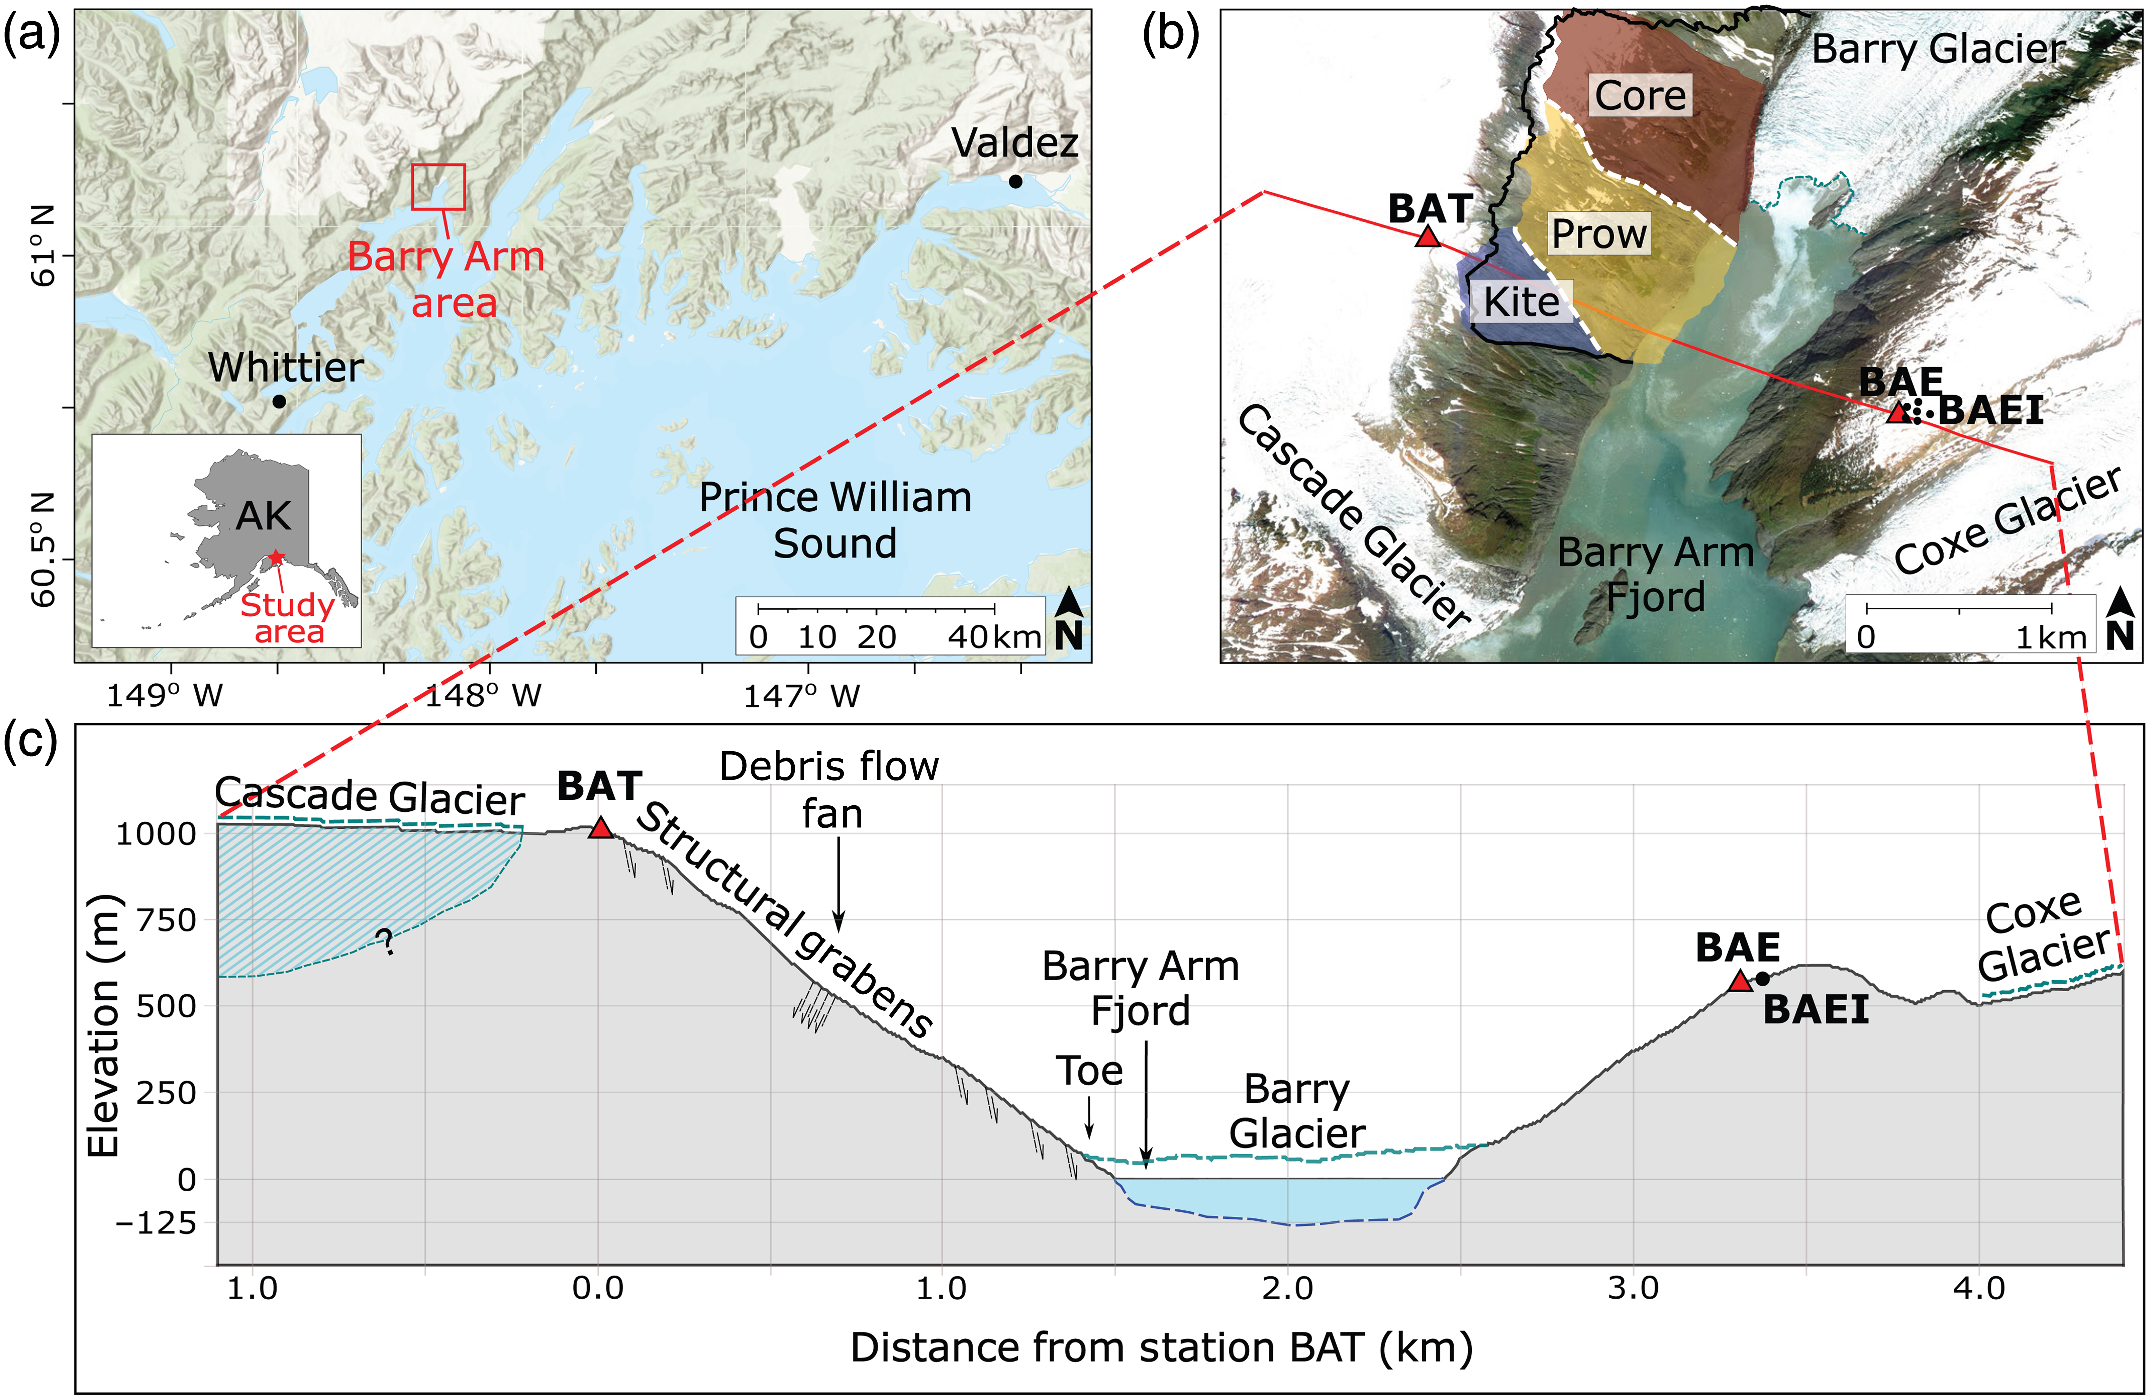
Figure 3. (a) Location of the Barry Arm area in relation to Prince William Sound and nearby communities, as well as location in relation to Alaska. (b) Barry Arm fjord detail showing the location of the Cascade, Coxe, and Barry Glaciers, as well as seismic stations BAT and BAE, and infrasound BAEI, and where the cross section is taken. The colored sections of the slope indicate the Kite (blue), Prow (yellow), and Core (red)—these locations are where the slope is most active. (c) Barry Arm fjord cross‐section diagram (1:1 scale) illustrating glacier features, fjord depth (slope profile derived from Google Earth; Google, n.d.), station locations, and structural features modified from Schaefer et al. (2023) Boundary for Cascade Glacier is inferred. (Figure and caption from https://doi.org/10.1785/0220250205.)


Four panels showing seismogram, spectrogram, and infrasound data for an earthquake, glacier event, rockfall, and short-impulsive (SI) event.

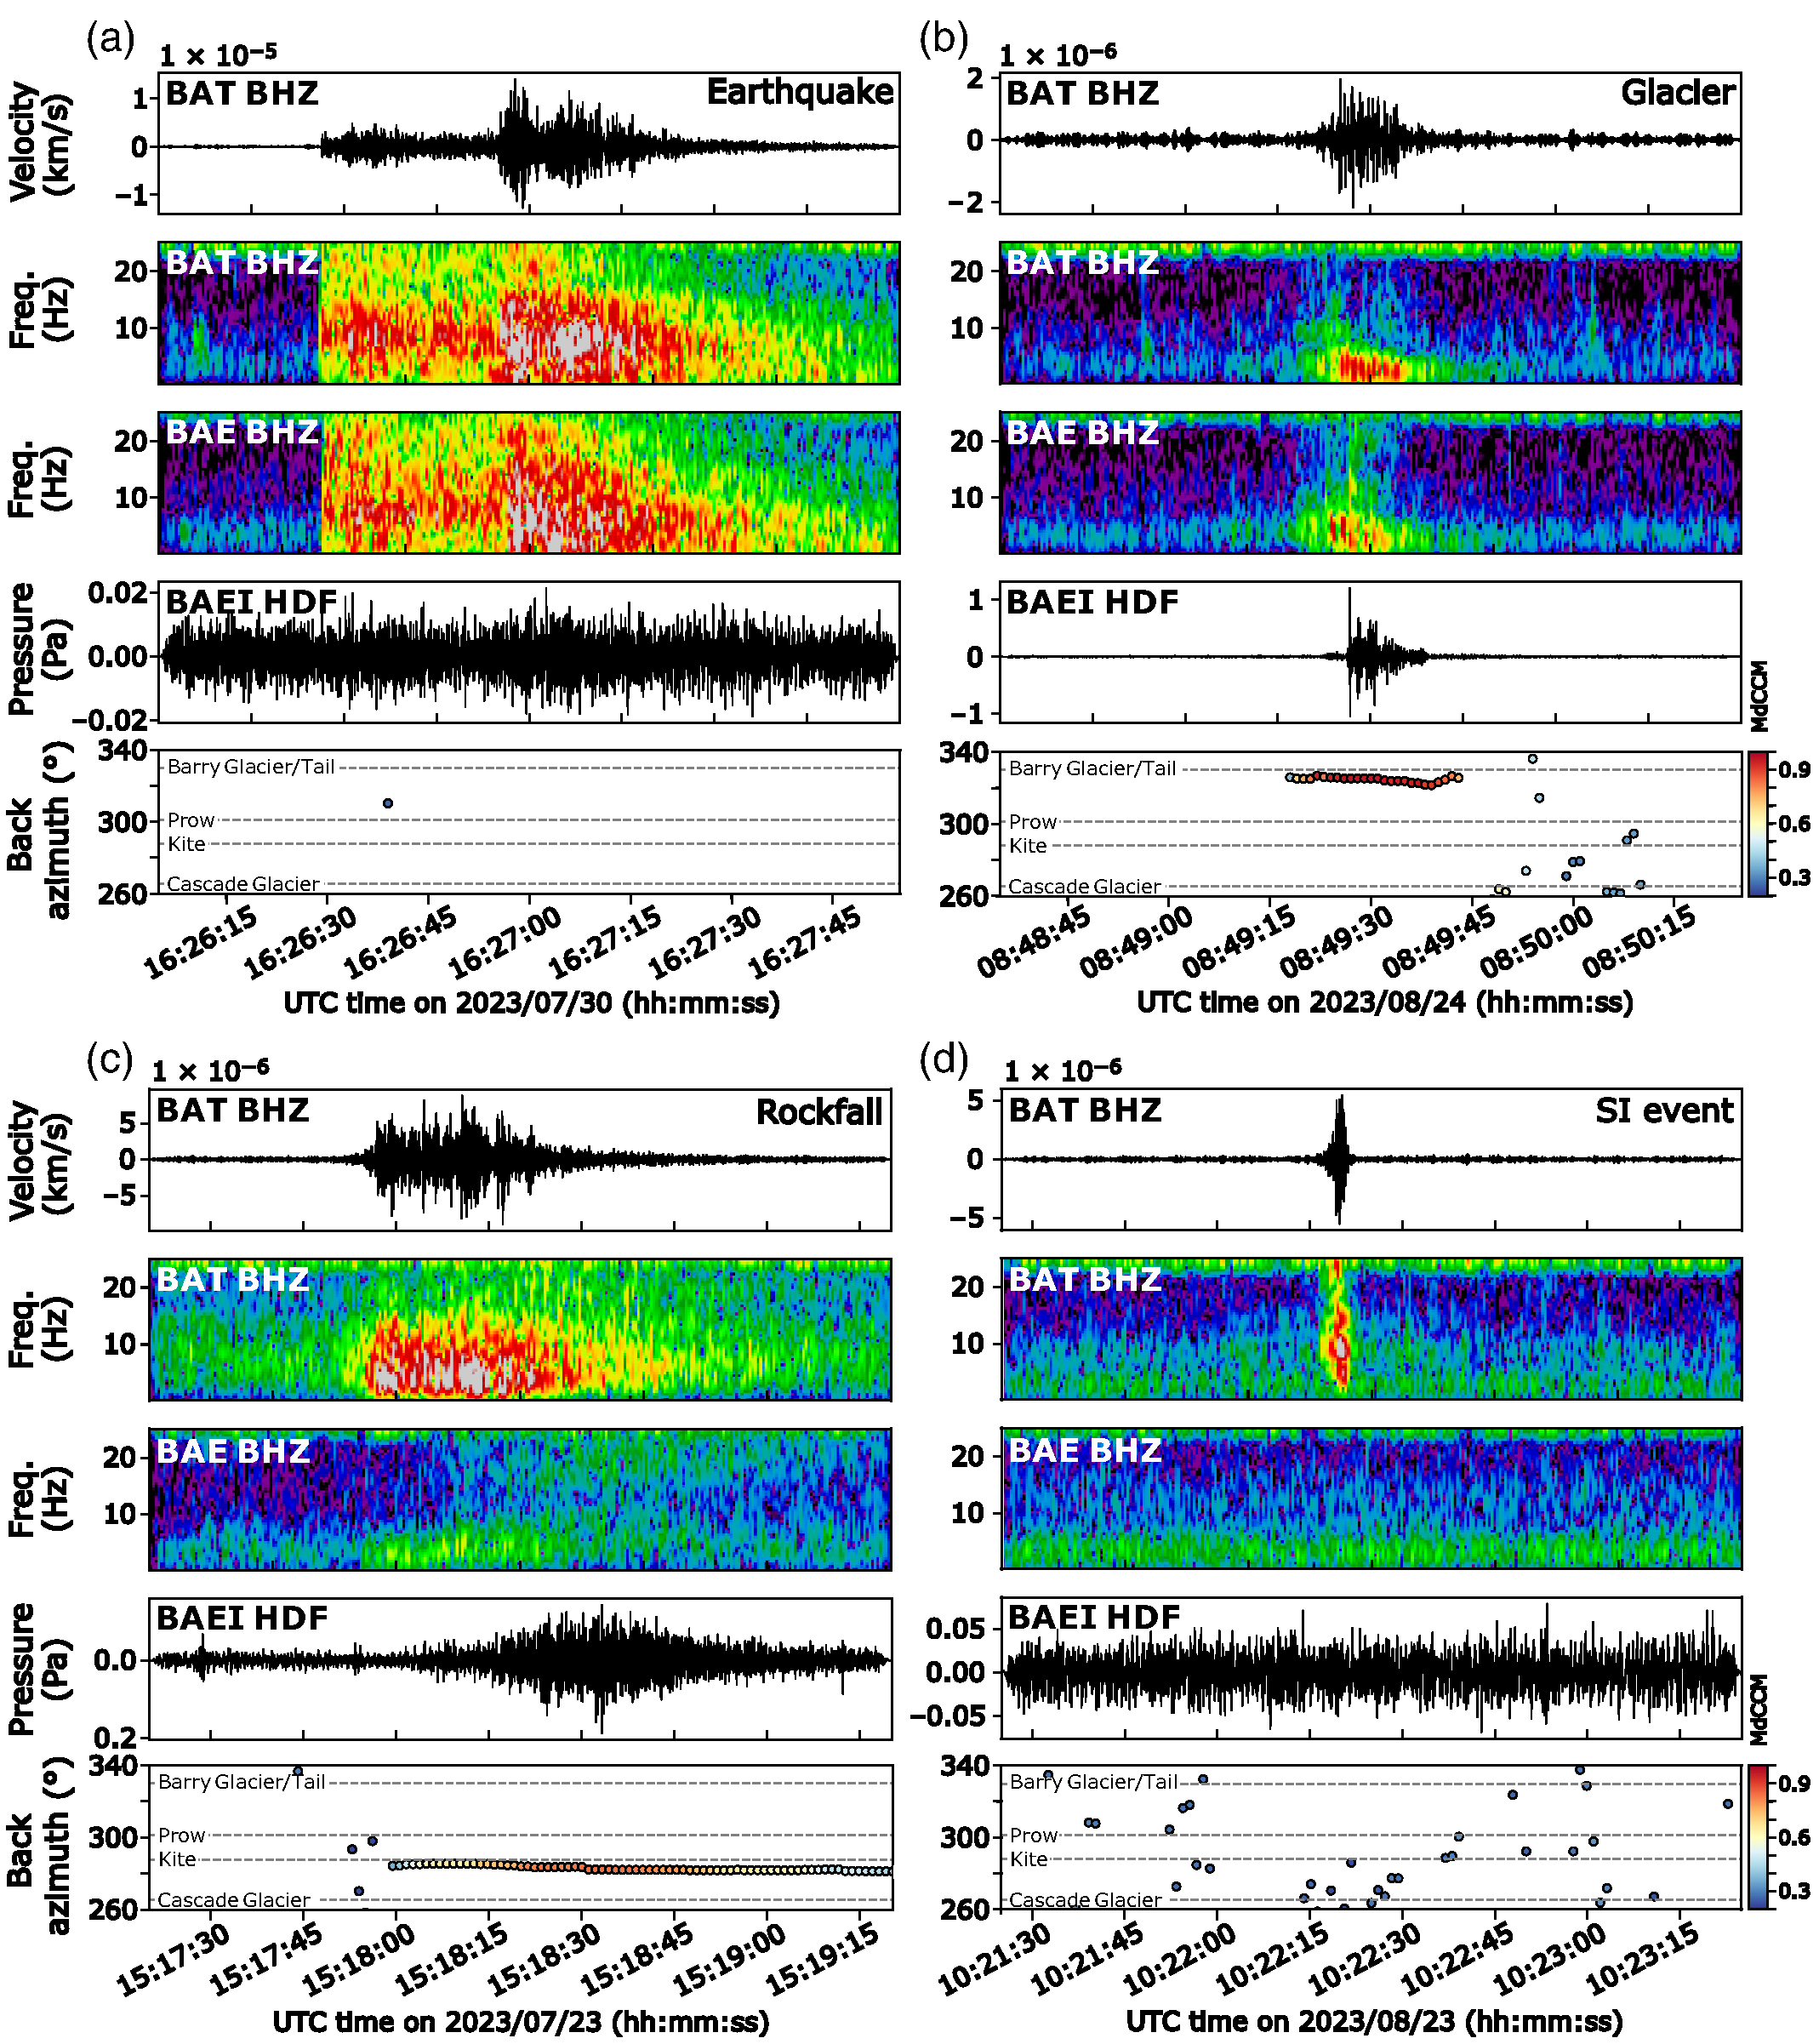
Figure 4. Seismogram, spectrogram, and infrasound (top to bottom) of an (a) earthquake, (b) glacier event, (c) rockfall, and (d) short‐impulsive (SI) event. Note that SI events do not appear on infrasound, nor station BAE, whereas rockfall and glacier events are present on infrasound and both seismic stations, and earthquakes are visible on both seismic stations. (Figure and caption from https://doi.org/10.1785/0220250205.)


Graph overlaying short-impulsive (SI) events with air temperature and weekly rainfall. Air temperature and SI events seem to follow similar patterns.

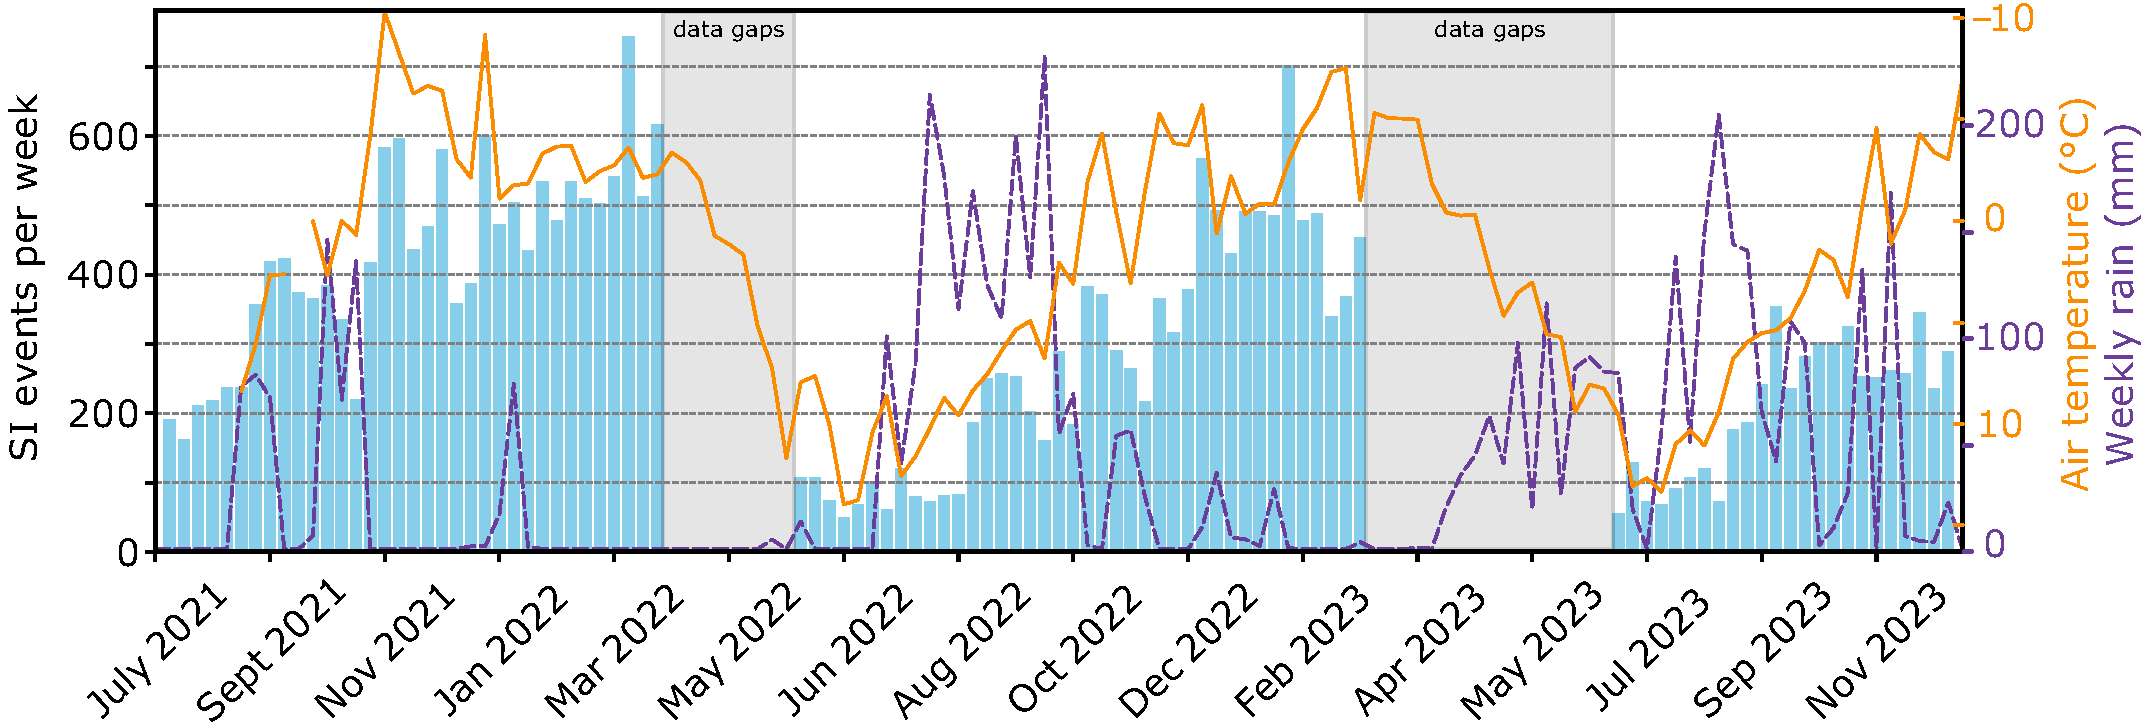
Figure 5. Histogram of SI events overlain with air temperature (orange) and weekly rainfall (purple) from July 2021 to December 2023. Note the data gaps in seismic stations from April to May 2022 and March to June 2023. (Figure and caption from https://doi.org/10.1785/0220250205.)


Top: graphic of water-filled cracks under glacier in summer. Bottom: Graphic of ice-filled cracks in winter, with path of potential crack propagation.

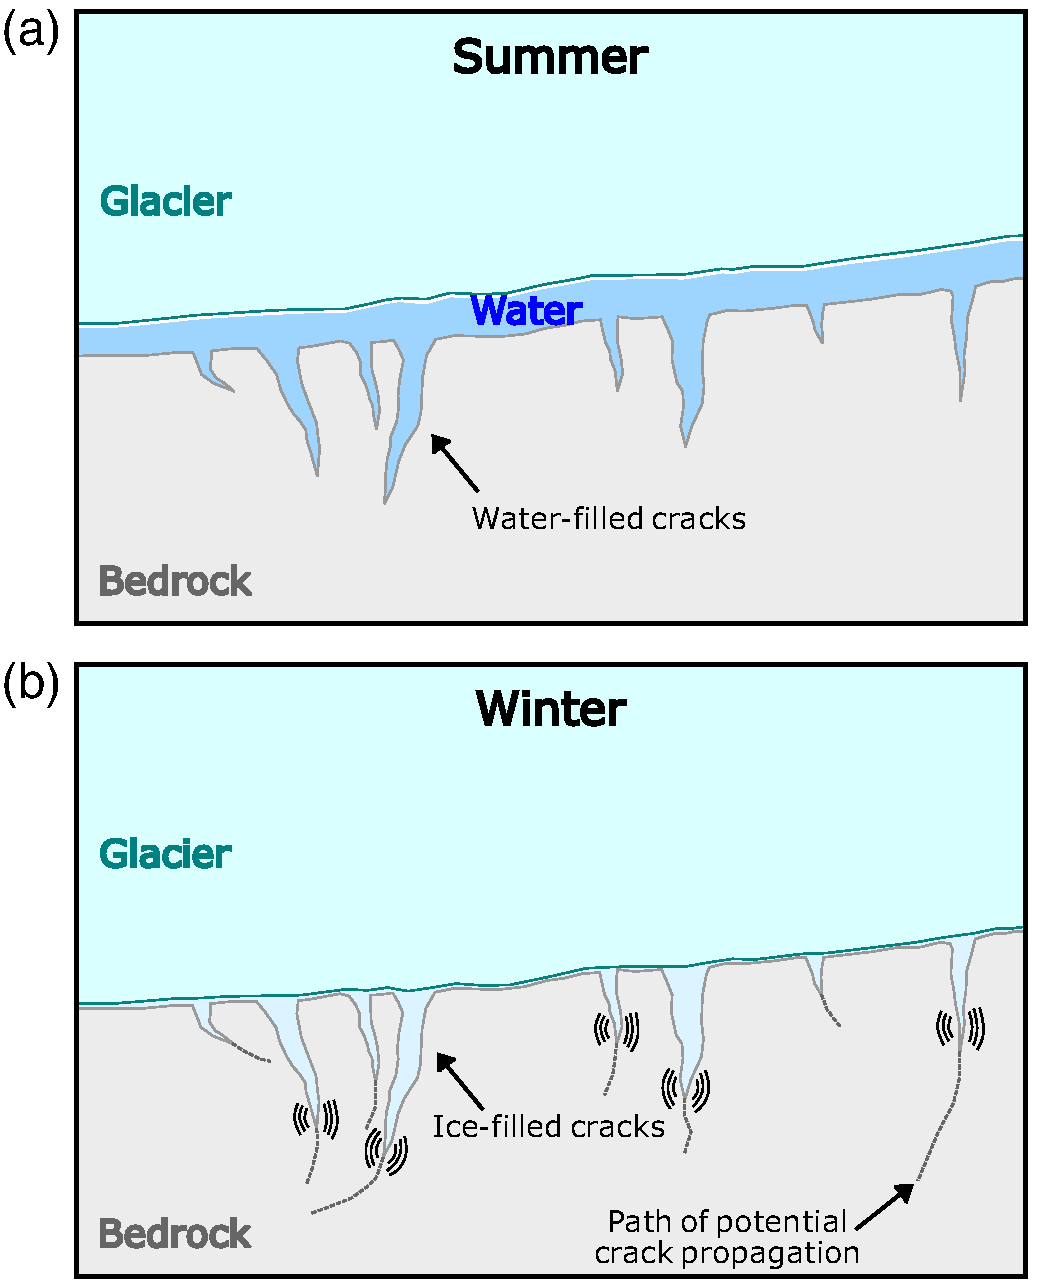
Figure 6. Seasonal “freeze‐up” cycle of subglacial (a) summer and (b) winter pathways. (Figure and caption from https://doi.org/10.1785/0220250205.)